
The Business & Community Newsletter – January 2017

Archived Content
Information identified as archived is provided for reference, research or recordkeeping purposes. It is not subject to the Government of Canada Web Standards and has not been altered or updated since it was archived. Please "contact us" to request a format other than those available.
I was born in Canada for a reason. It was because my parents wanted me to have the freedoms that this country offers.
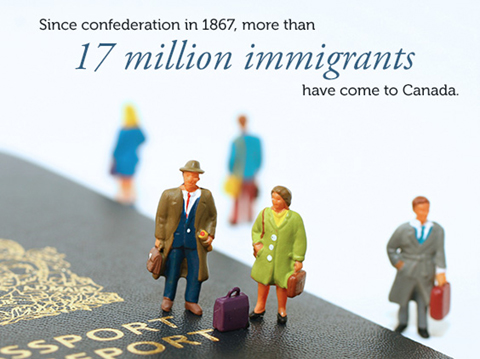
Image description - 17 million immigrants
Since confederation in 1867, more than 17 million immigrants have come to Canada.
Since Confederation in 1867, more than 17 million immigrants have come to Canada. Even the country's first prime minister, Sir John A. MacDonald himself was born outside of Canada – in Scotland. In 2011, about one in five people living in Canada were immigrants. It's safe to say that many more Canadians today are children of one or more immigrant.
The January edition of the newsletter puts the spotlight on immigration and features the latest Statistics Canada reports and products on this topic.
Feature articles
150 years of immigration in Canada
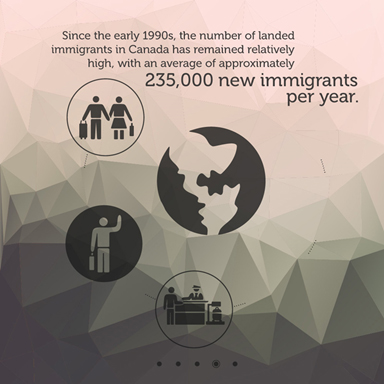
Image description - 150 years of immigration in Canada
Since the early 1990s, the number of landed immigrants in Canada has remained relatively high, with an average of approximately 235,000 new immigrants per year.
The annual number of landed immigrants in Canada has fluctuated considerably over the last 150 years. Some of these fluctuations can be linked to immigration policy changes, others to Canada's economic situation or world events connected with the movement of migrants and refugees.
For example, in the late 1800s, the number of immigrants admitted annually to Canada varied between 6,300 and 133,000. Record numbers of immigrants were admitted in the early 1900s when Canada was promoting the settlement of Western Canada. The highest number ever recorded was in 1913, when more than 400,000 immigrants arrived in the country.
However, the number of people entering the country dropped dramatically during World War I, to fewer than 34,000 landed immigrants in 1915. The lowest numbers of landed immigrants were recorded during the Great Depression in the 1930s and during World War II. The return of peace fostered economic recovery and an immigration boom in Canada.
Other record levels of immigration have been registered during political and humanitarian crises, including in 1956 and 1957, when 37,500 Hungarian refugees arrived in the country, and in the 1970s and 1980s, when a large number of Ugandan, Chilean, Vietnamese, Cambodian and Laotian refugees came to Canada.
Since the early 1990s, the number of landed immigrants has remained relatively high, with an average of approximately 235,000 new immigrants per year.
For more interesting history and trends about immigration, read the article “150 years of immigration in Canada”.
Study: Patterns and determinants of immigrants' sense of belonging to Canada and their source country, 1980 to 2012
In 2013, almost 7 in 10 immigrants who had landed in Canada between 1980 and 2012 had a strong sense of belonging to both Canada and their source country.
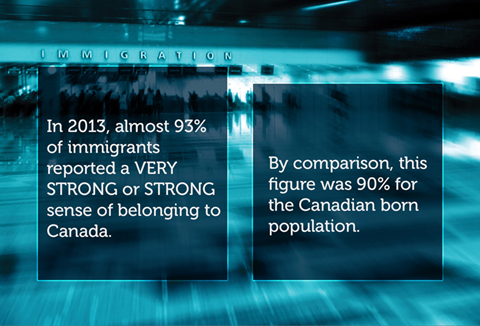
Image description - Sense of belonging to Canada
In 2013, almost 93% of immigrants reported a very strong or strong sense of belonging to Canada. By comparison, this figure was 90% for the Canadian born population.
The new study, "Patterns and Determinants of Immigrants' Sense of Belonging to Canada and Their Source Country," examines the distribution of immigrants across four combinations of their sense of belonging: a strong sense of belonging to both Canada and their source country; a strong sense of belonging to Canada only; a strong sense of belonging to their source country only; and a weak sense of belonging to both Canada and their source country.
The study was based on a nationally representative sample of about 7,000 immigrants from over 100 countries who landed in Canada between 1980 and 2012.
About 69% of immigrants had a strong sense of belonging to both Canada and their source country, while 24% of immigrants had a strong sense of belonging to Canada and a weak sense of belonging to their source country. Very few had a strong sense of belonging to their source country, but a weak sense of belonging to Canada (3%), or a weak sense of belonging to both Canada and their source country (4%).
Compared with immigrants who had a strong sense of belonging to both Canada and their source country, several factors came into play for immigrants in the three other groups. Immigrants with a strong sense of belonging to Canada only were more likely to have arrived in Canada at younger ages, to have resided in Canada for many years, and to have come from countries with lower levels of civil liberty and life satisfaction as measured in international data sources.
Immigrants with a strong sense of belonging to their source country only tended to have immigrated at older ages, to have resided in Canada for fewer years, and to have come from countries where life satisfaction was high. They also reported more experiences of discrimination in Canada.
Immigrants with a weak sense of belonging to both Canada and their source country were over-represented among those who were unemployed, had very low income, and had never married.
Immigration, Business Ownership and Employment in Canada

Image description - Immigration, Business Ownership and Employment in Canada
Immigrants who have been in Canada for more than 10 years have higher rates of private incorporated business ownership than individuals born in Canada.
Immigrants who have been in Canada for more than 10 years have higher rates of private incorporated business ownership than individuals born in Canada. However, the types of businesses owned by immigrants tend to employ fewer paid workers than those owned by individuals born in Canada, according to a new study.
Rates of business ownership are relatively low among immigrants during their initial years in Canada, but, over time, these rates surpass those for individuals born in Canada.
Among immigrant taxfilers who had been in Canada for 10 to 30 years in 2010, about 6% were owners of private incorporated businesses that employed paid workers. This compares with about 5% of Canadian-born taxfilers. But, while immigrant-owned private incorporated businesses employed, on average, about four paid workers, those owned by Canadian-born individuals had about seven paid workers.
Of all immigrant-owned private incorporated businesses, 45% were located in four industries: professional, scientific and technical services; retail trade; accommodation and food services; and transportation and warehousing. One-third of private incorporated businesses owned by Canadian-born individuals were in these four industries.
For more details, please read the full research study "Immigration, Business Ownership and Employment in Canada".
Videos on immigration & diversity
 These two videos were first published in 2015 and 2013 respectively by Statistics Canada and are worth another look.
A Statistics Canada Minute - Immigration and Diversity presents the key facts and trends on Canada's immigration and diversity in just over one minute.
In this video titled “A brief overview of immigration and ethnocultural diversity in Canada, 2011 NHS”, Statistics Canada's Sociologist, Tina Chui, speaks about the key findings from the 2011 National Household Survey.
More immigration data at your finger tips
Ready to explore more immigration data? Simply consult the Ethnic diversity and immigration section on Statistics Canada's website. Here you will find a comprehensive list of articles, reports and data tables on ethnic groups, visible minorities, immigrants and non-permanent residents, generation status in Canada and much more.
Customized products and services
We've just touched on some of the information you can get from Statistics Canada. Visit our website to find those topics of interest to you. And, to help you make sense of it all, Statistics Canada offers a variety of customized products and services to serve clients. Our professionals will assist you in identifying your information needs and product portfolio and recommend the most appropriate Statistics Canada products and services in line with your budget. This service includes custom data, maps, research and analysis. For more information, consult the Customized products and services section of our website.
Test your knowledge on immigration
Now that you know more about immigration data at statistics Canada, are you ready for a quiz?
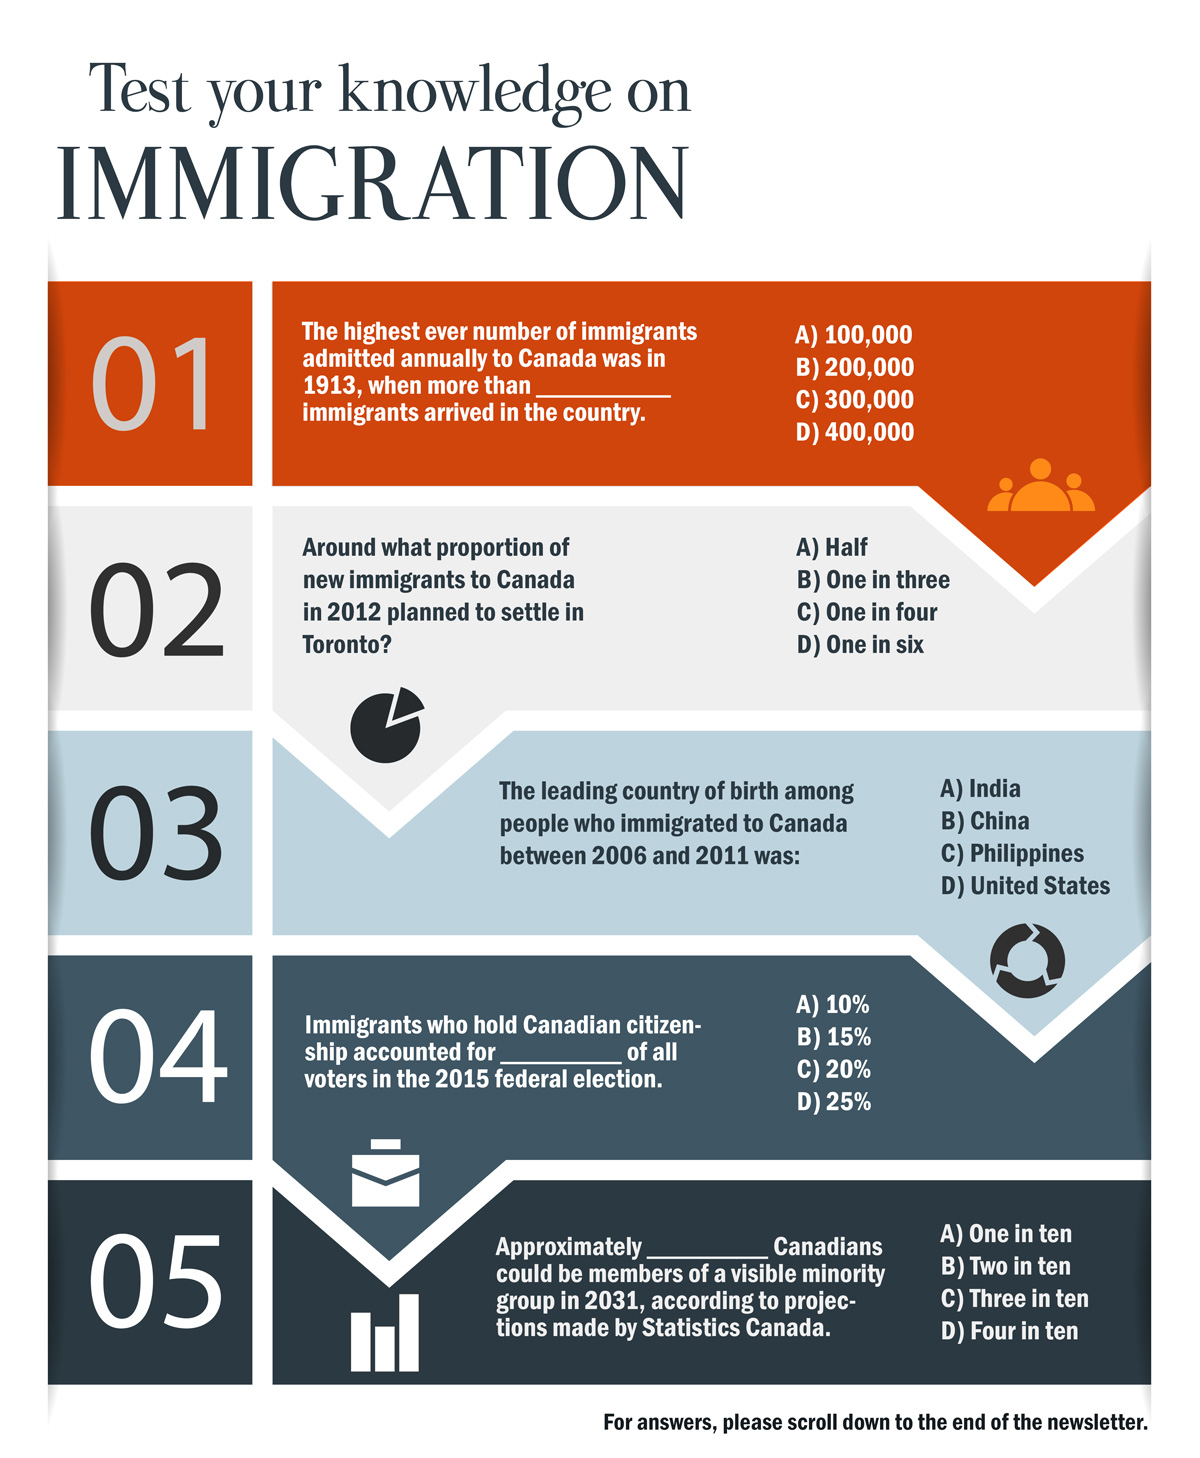
Image description - Test your knowledge on immigration
01 The highest ever number of immigrants admitted annually to Canada was in 1913, when more than __________ immigrants arrived in the country.
A) 100,000
B) 200,000
C) 300,000
D) 400,000
02 Around what proportion of new immigrants to Canada in 2012 planned to settle in Toronto?
A) Half
B) One in three
C) One in four
D) One in six
03 The leading country of birth among people who immigrated to Canada between 2006 and 2011 was:
A) India
B) China
C) Philippines
D) United States
04 Immigrants who hold Canadian citizenship accounted for _________ of all voters in the 2015 federal election.
A) 10%
B) 15%
C) 20%
D) 25%
05 Approximately _________ Canadians could be members of a visible minority group in 2031, according to projections made by Statistics Canada.
A) One in ten
B) Two in ten
C) Three in ten
D) Four in ten
For answers, please scroll down to the end of the newsletter.
Also worth reading
How is Statistics Canada turning millions of census questionnaires into data?
 The 2016 Census reached millions of Canadian households from coast to coast to coast. This represents just as many questionnaires! What happens to these questionnaires once Statistics Canada receives them? How are they turned into data? In this article, we shed light on this enormous, important task and take you through the steps Statistics Canada follows before publishing census data.
Receiving census questionnaires
All census questionnaires completed online, by phone and on paper are sent to Statistics Canada's Data Operations Centre (DOC). All questionnaires are registered at the centre, and the paper ones are scanned to capture data with optical mark recognition and intelligent character recognition technologies. If automated recognition fails, manual keying is used.
The next step: Editing
Statistics Canada systems and staff make a series of edits to ensure coverage and completeness of responses.
In a coverage edit, responses are checked for inconsistencies that could indicate respondent or data capture errors, such as duplicate people, false person data or missing persons as respondents were unsure whom to include on the questionnaire (e.g. children in shared custody or at university). Edit failures are resolved automatically or by clerks manually, when possible.
In a completeness edit, each questionnaire returned is automatically evaluated to determine the number of answered and unanswered questions. Households with a high number of unanswered questions or failed coverage checks are sent to the failed edit follow-up team. Statistics Canada employees in five regional call centres contact these households to get missing information and to ensure that the correct people are enumerated in each household.
Coding, more editing and imputation
Write-in responses require coding. For example, written responses to work-related questions must be assigned the appropriate industrial and occupational codes. These are coded using automated methods as much as possible, while clerks manually code the remainder.
Once data have successfully passed through all the processing steps at the DOC, they are then loaded into the response database. This, however, is not the final step.
Editing and imputing, as well as the final cleanup of data, are performed automatically using special software. The final editing process detects errors, and the imputation process corrects them. This phase provides consistent estimates and adjusts invalid or missing responses. For example, family patterns are constructed based on information provided by respondents on age, sex, marital status and other topics. If these data are missing or inconsistent, family characteristics cannot be compiled.
Confidentiality
Statistics Canada places the highest priority on maintaining the confidentiality of individual census questionnaires—from collection to data release. To ensure confidentiality during processing, the agency applies a number of measures in the contexts of security, general technology, and shipping and receiving.
And finally… dissemination!
After all this work, the 2016 Census data are ready for dissemination. Data will be published on the Statistics Canada website beginning on February 8, 2017. For more detailed information, visit the Census Program section on our website.
2021 Census content consultation
Statistics Canada is currently preparing for the 2021 Census content consultation, scheduled to run from September to December 2017. Invitations to participate will be emailed to individuals and organizations known to use census data.
Our target audience includes census data users representing federal, provincial, territorial and municipal government contacts, aboriginal leaders, academics, non-governmental organizations and private businesses. Statistics Canada will also reach out to the general public through its website, social media accounts and regional offices. All participants in this consultation will be asked to complete the same electronic questionnaire.
This public consultation will gather valuable information on the relevance of the census, the extent of users' needs, populations of interest, suitability of alternative sources, multivariate analysis, comparability across Canada, continuity over time and the required frequency of outputs.
For more information, or to have your name and email address added to our list of consultation participants, please contact the 2021 Census Content Determination Team at 2021Census_Recensement_consultation@canada.ca.
Immigration quiz answers:
01: D (Source: 150 years of immigration in Canada)
02: B (Source: Study: Changes in the regional distribution of new immigrants to Canada)
03: C (Source: Immigration and Ethnocultural Diversity in Canada)
04: C (Source: Study: Understanding the increase in voting rates between the 2011 and 2015 federal elections)
05: C (Source: Projections of the Diversity of the Canadian Population)
- Date modified: