
Chart 1
Regression results for skill-level requirements, by educational level, men aged 25 to 34

Archived Content
Information identified as archived is provided for reference, research or recordkeeping purposes. It is not subject to the Government of Canada Web Standards and has not been altered or updated since it was archived. Please "contact us" to request a format other than those available.
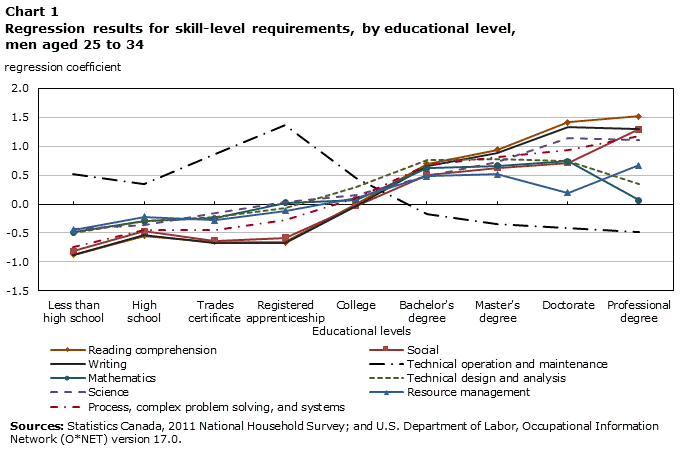
Description for Chart 1
| Educational level | Reading comprehension | Social | Writing | Technical operation and maintenance | Mathematics | Technical design and analysis | Science | Resource management | Process, complex problem solving, and systems |
|---|---|---|---|---|---|---|---|---|---|
| regression coefficient | |||||||||
| Less than high school |
-0.880 | -0.819 | -0.885 | 0.519 | -0.488 | -0.497 | -0.438 | -0.442 | -0.750 |
| High school |
-0.551 | -0.468 | -0.542 | 0.338 | -0.301 | -0.300 | -0.360 | -0.219 | -0.450 |
| Trades certificate |
-0.654 | -0.637 | -0.670 | 0.868 | -0.249 | -0.221 | -0.153 | -0.281 | -0.445 |
| Registered apprenticeship |
-0.657 | -0.579 | -0.674 | 1.359 | 0.025 | -0.071 | 0.030 | -0.114 | -0.283 |
| College | 0.005 | -0.033 | -0.036 | 0.446 | 0.076 | 0.302 | 0.158 | 0.096 | 0.103 |
| Bachelor's degree |
0.697 | 0.506 | 0.656 | -0.165 | 0.615 | 0.753 | 0.488 | 0.477 | 0.671 |
| Master's degree |
0.936 | 0.629 | 0.891 | -0.343 | 0.661 | 0.784 | 0.733 | 0.514 | 0.811 |
| Doctorate | 1.415 | 0.710 | 1.332 | -0.406 | 0.744 | 0.736 | 1.135 | 0.196 | 0.942 |
| Professional degree |
1.518 | 1.296 | 1.294 | -0.477 | 0.066 | 0.341 | 1.099 | 0.668 | 1.172 |
| Sources: Statistics Canada, 2011 National Household Survey; and U.S. Department of Labor, Occupational Information Network (O*NET) version 17.0. | |||||||||
- Date modified: