
Chart 3
Average overall earnings of Canadian-born couples, by gender and education level

Archived Content
Information identified as archived is provided for reference, research or recordkeeping purposes. It is not subject to the Government of Canada Web Standards and has not been altered or updated since it was archived. Please "contact us" to request a format other than those available.
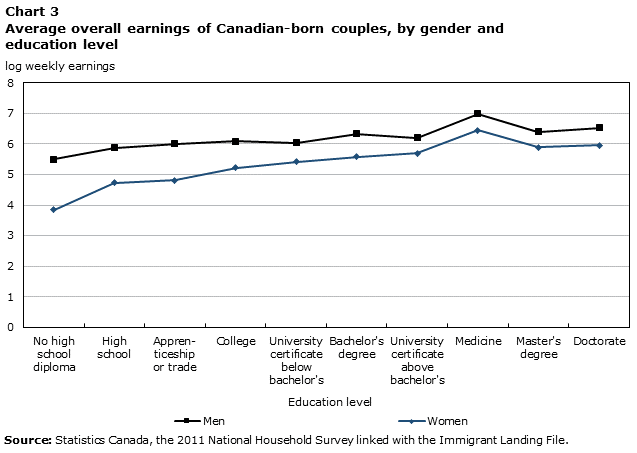
Description for Chart 3
| Education level | Men | Women |
|---|---|---|
| log weekly earnings | ||
| No high school diploma |
5.504 | 3.843 |
| High school |
5.880 | 4.734 |
| Appren- ticeship or trade |
6.000 | 4.803 |
| College | 6.093 | 5.228 |
| University certificate below bachelor's |
6.041 | 5.411 |
| Bachelor's degree |
6.340 | 5.578 |
| University certificate above bachelor's |
6.197 | 5.702 |
| Medicine | 6.992 | 6.448 |
| Master's degree |
6.408 | 5.896 |
| Doctorate | 6.524 | 5.956 |
| Source: Statistics Canada, the 2011 National Household Survey linked with the Immigrant Landing File. | ||
- Date modified: