
Economy

Archived Content
Information identified as archived is provided for reference, research or recordkeeping purposes. It is not subject to the Government of Canada Web Standards and has not been altered or updated since it was archived. Please "contact us" to request a format other than those available.
Tables
- Table 21 Gross domestic product at basic prices, by industry
- Table 22 Exchange rates in Canadian dollars
- Table 23 Consumer Price Index, selected components
- Table 24 Retail sales, by industry
- Table 25 International position in securities
Charts
- Chart 12 Real gross domestic product at market prices
- Chart 13 Current account balances
-
Chart 14 Canada's international investment position
View tables
| 2002 | 2006 | 2010 | |
|---|---|---|---|
| $ millions chained 2002 | |||
| All industries | 1,068,765 | 1,191,403 | 1,233,930 |
| Agriculture, forestry, fishing and hunting | 23,293 | 27,958 | 28,486 |
| Mining and oil and gas extraction | 53,488 | 57,271 | 54,967 |
| Utilities | 28,883 | 30,150 | 32,624 |
| Construction | 57,775 | 69,462 | 73,467 |
| Manufacturing | 182,736 | 185,527 | 158,326 |
| Wholesale trade | 55,226 | 66,839 | 68,822 |
| Retail trade | 58,483 | 68,822 | 75,634 |
| Transportation and warehousing | 50,066 | 56,829 | 57,569 |
| Information and cultural industries | 38,229 | 43,583 | 45,240 |
| Finance and insurance | 63,630 | 75,762 | 82,402 |
| Real estate and rental and leasing | 131,410 | 147,794 | 164,546 |
| Professional, scientific and technical services | 48,481 | 57,030 | 59,948 |
| Administrative and support, waste management and remediation services | 24,853 | 29,539 | 30,329 |
| Educational services | 51,593 | 57,008 | 62,539 |
| Health care and social assistance | 68,142 | 74,468 | 82,761 |
| Arts, entertainment and recreation | 10,398 | 10,826 | 11,359 |
| Accommodation and food services | 25,408 | 26,141 | 26,611 |
| Public administration | 61,523 | 67,452 | 75,390 |
| Other services | 27,230 | 30,514 | 32,329 |
| Note: North American Industry Classification System (NAICS), 2002. | |||
| Source: Statistics Canada, CANSIM table 379-0027. | |||
| 2002 | 2011 | |
|---|---|---|
| United States dollar | 1.5703 | 0.9893 |
| Japanese yen | 0.0126 | 0.0124 |
| United Kingdom pound sterling | 2.3587 | 1.5859 |
| Mexican peso | 0.1629 | 0.0797 |
| European euro | 1.4838 | 1.3761 |
| Note: Noon spot rate | ||
| Sources: Bank of Canada and Statistics Canada, CANSIM table 176-0064. | ||
| 1971 to 1980 |
1981 to 1990 |
1991 to 2000 |
2001 to 2010 |
|
|---|---|---|---|---|
| 10-year % change | ||||
| All-items CPI | 8.6 | 5.2 | 1.6 | 2.0 |
| Food | 11.2 | 4.3 | 1.3 | 2.6 |
| Shelter | .. | 5.7 | 1.1 | 2.5 |
| Rented accommodation | 4.4 | 5.1 | 1.5 | 1.4 |
| Owned accommodation | 9.4 | 6.1 | 0.4 | 2.9 |
| Water, fuel and electricity | 11.9 | 4.9 | 3.1 | 2.8 |
| Electricity | 9.4 | 5.8 | 1.7 | 3.0 |
| Water | .. | 6.8 | 3.6 | 6.4 |
| Natural gas | 12.0 | 2.2 | 5.7 | -0.6 |
| Fuel oil and other fuel | 15.8 | 4.4 | 3.7 | 6.0 |
| Household operations | .. | 4.4 | 1.4 | 1.9 |
| Household furnishings and equipment | .. | 3.8 | 0.7 | -0.4 |
| Clothing and footwear | 6.7 | 3.8 | 0.7 | -1.0 |
| Transportation | 8.0 | 5.2 | 3.2 | 2.2 |
| Gasoline | 10.2 | 5.5 | 2.7 | 4.4 |
| Health and personal care | 8.0 | 5.3 | 1.5 | 1.7 |
| Recreation, education and reading | 6.3 | 5.2 | 2.4 | 0.6 |
| Alcoholic beverages and tobacco products | 7.1 | 9.9 | 0.4 | 5.1 |
| .. not available for a specific reference period | ||||
| Note: Compound annual growth rates. | ||||
| Source: Statistics Canada, CANSIM table 326-0020. | ||||
| 2000 | 2005 | 2010 | |
|---|---|---|---|
| $ millions | |||
| Retail trade | 287,838 | 365,994 | 438,401 |
| Motor vehicle and parts dealers | 73,903 | 86,903 | 95,445 |
| New car dealers | 61,031 | 71,603 | 76,417 |
| Used car dealers | .. | 4,212 | 5,747 |
| Other motor vehicle dealers | .. | 6,434 | 6,901 |
| Automotive parts, accessories and tire stores | .. | 4,653 | 6,381 |
| Furniture stores | 6,528 | 8,913 | 9,670 |
| Home furnishings stores | 2,975 | 4,649 | 5,359 |
| Electronics and appliance stores | 9,212 | 11,709 | 14,027 |
| Building material and garden equipment and supplies dealers | 13,590 | 22,598 | 27,760 |
| Food and beverage stores | 68,041 | 86,117 | 103,407 |
| Supermarkets and other grocery (except convenience) stores | 49,657 | 62,185 | 73,644 |
| Beer, wine and liquor stores | 11,107 | 14,365 | 18,248 |
| Health and personal care stores | 17,854 | 23,667 | 32,464 |
| Gasoline stations | 26,676 | 37,828 | 48,656 |
| Clothing and clothing accessories stores | 18,193 | 21,049 | 24,806 |
| Sporting goods, hobby, book and music stores | 7,899 | 9,383 | 11,291 |
| General merchandise stores | 35,205 | 43,756 | 54,657 |
| Miscellaneous store retailers | 7,762 | 9,422 | 10,861 |
| .. not available for a specific reference period | |||
| Note: North American Industry Classification System (NAICS), 2007. | |||
| Source: Statistics Canada, CANSIM table 080-0020. | |||
| 1995 | 2000 | 2005 | 2010 | |
|---|---|---|---|---|
| $ millions (at market value) | ||||
| Canadian portfolio investment abroad |
141,634 | 397,231 | 546,868 | 680,893 |
| Foreign bonds | 20,045 | 37,429 | 88,796 | 138,450 |
| Foreign stocks | 121,589 | 359,802 | 444,964 | 535,716 |
| Foreign money market1 | .. | .. | 13,108 | 6,726 |
| Foreign portfolio investment in Canada |
488,330 | 629,620 | 706,751 | 1,006,774 |
| Canadian bonds | 366,326 | 387,805 | 414,473 | 613,250 |
| Canadian stocks | 77,891 | 213,854 | 271,379 | 357,896 |
| Canadian money market | 44,113 | 27,961 | 20,899 | 35,628 |
| .. not available for a specific reference period | ||||
| 1. Introduced in 2002. | ||||
| Source: Statistics Canada, CANSIM table 376-0055. | ||||
View charts
Chart 12 Real gross domestic product at market prices
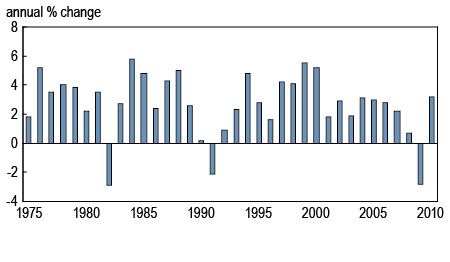
Note: Chained 2002 dollars.
Source: Statistics Canada, CANSIM table 380-0017.
Chart 13 Current account balances
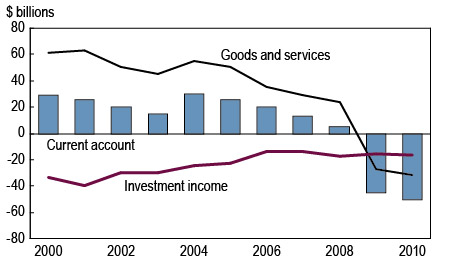
Sources: Statistics Canada, CANSIM table 376-0001.
Chart 14 Canada's international investment position
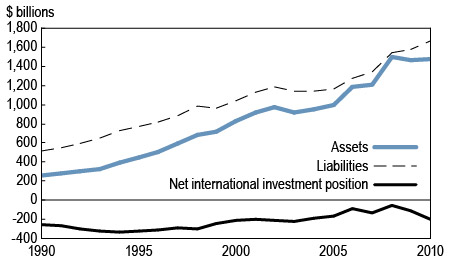
Source: Statistics Canada, CANSIM table 376-0037.
- Date modified: