
Government

Archived Content
Information identified as archived is provided for reference, research or recordkeeping purposes. It is not subject to the Government of Canada Web Standards and has not been altered or updated since it was archived. Please "contact us" to request a format other than those available.
Tables
- Table 16 Federal government finance
Charts
-
Chart 10 Central bank rate
View tables
| 2000 | 2005 | 2010 | |
|---|---|---|---|
| $ millions | |||
| Revenue | 195,726 | 219,765 | 228,632 |
| Taxes | 164,077 | 188,645 | 193,848 |
| Taxes on income, profits, and capital gains | 125,738 | 140,129 | 148,237 |
| Taxes on goods and services | 35,898 | 45,202 | 42,185 |
| Taxes on international trade and transactions | 2,441 | 3,314 | 3,426 |
| Social contributions | 18,751 | 17,830 | 17,366 |
| Grants, revenue | 739 | 1,049 | 939 |
| Other revenue | 12,159 | 12,241 | 16,479 |
| Expenses | 175,636 | 218,551 | 269,987 |
| Gross operating balance | 23,541 | 4,994 | -36,566 |
| Net operating balance | 20,090 | 1,214 | -41,355 |
| Net acquisition of nonfinancial assets | 62 | 195 | 1,230 |
| Net lending or borrowing | 20,028 | 1,019 | -42,585 |
| Net acquisition of financial assets | 3,371 | 14,786 | 3,748 |
| Net incurrence of liabilities | -17,064 | 14,012 | 46,956 |
| Statistical discrepancy | -407 | 245 | 623 |
| Total expenditure | 175,698 | 218,746 | 271,217 |
| Net worth | -2,078,221 | -1,953,126 | -2,100,580 |
| Nonfinancial assets | 189,098 | 204,714 | 239,520 |
| Financial assets | 368,439 | 431,625 | 1,017,076 |
| Liabilities | 2,635,758 | 2,589,465 | 3,357,176 |
| Net financial worth | -2,267,319 | -2,157,840 | -2,340,100 |
| Source: Statistics Canada, CANSIM table 385-0032. | |||
View charts
Chart 10 Central bank rate
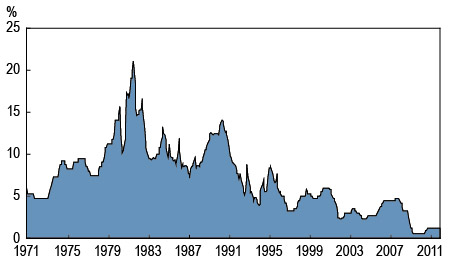
Sources: Bank of Canada and Statistics Canada, CANSIM table 176-0043.
- Date modified: