
International trade

Archived Content
Information identified as archived is provided for reference, research or recordkeeping purposes. It is not subject to the Government of Canada Web Standards and has not been altered or updated since it was archived. Please "contact us" to request a format other than those available.
Tables
Charts
- Chart 15 Merchandise trade balance
View tables
| Exports | Imports | Trade balance | |
|---|---|---|---|
| $ millions | |||
| Total | 404,834 | 413,833 | -8,999 |
| United States | 296,672 | 259,953 | 36,719 |
| Japan | 9,717 | 10,067 | -351 |
| United Kingdom | 16,986 | 9,561 | 7,425 |
| Other European Union countries | 19,476 | 30,788 | -11,313 |
| Other OECD countries | 17,908 | 29,013 | -11,105 |
| Other countries | 44,076 | 74,451 | -30,375 |
| Note: Balance of payments basis. | |||
| Source: Statistics Canada, CANSIM table 228-0003. | |||
| $ millions | % | |
|---|---|---|
| Exports | 404,834 | 100.0 |
| Agricultural and fishing products | 36,938 | 9.1 |
| Forestry products | 21,851 | 5.4 |
| Energy products | 90,886 | 22.5 |
| Industrial goods and materials | 96,489 | 23.8 |
| Machinery and equipment | 76,095 | 18.8 |
| Automotive products | 56,783 | 14.0 |
| Other consumer goods | 16,428 | 4.1 |
| Other | 9,364 | 2.3 |
| Imports | 413,833 | 100.0 |
| Agricultural and fishing products | 29,579 | 7.1 |
| Forestry products | 2,648 | 0.6 |
| Energy products | 40,549 | 9.8 |
| Industrial goods and materials | 86,926 | 21.0 |
| Machinery and equipment | 113,878 | 27.5 |
| Automotive products | 68,713 | 16.6 |
| Other consumer goods | 57,771 | 14.0 |
| Other | 13,770 | 3.3 |
| Note: Balance of payments basis. | ||
| Source: Statistics Canada, CANSIM table 228-0043. | ||
View charts
Chart 15 Merchandise trade balance
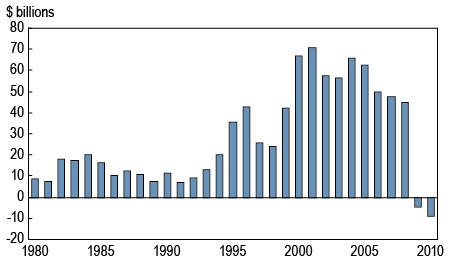
Note: Balance of payments basis.
Source: Statistics Canada, CANSIM table 228-0003.
- Date modified: