
Manufacturing

Archived Content
Information identified as archived is provided for reference, research or recordkeeping purposes. It is not subject to the Government of Canada Web Standards and has not been altered or updated since it was archived. Please "contact us" to request a format other than those available.
Tables
- Table 29 Manufacturing industries, selected statistics
- Table 30 New motor vehicle sales, by country of manufacture
Charts
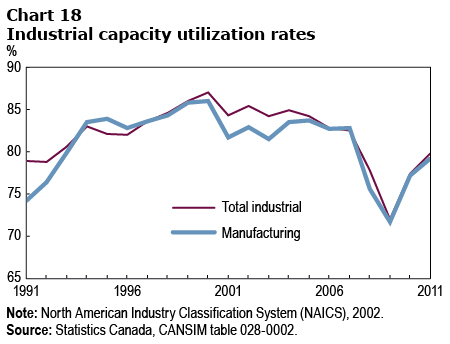
- Chart 18 Industrial capacity utilization rates
View tables
| 2006 | 2008 | 2010 | |
|---|---|---|---|
| $ millions | |||
| Revenue | 645,222.1 | 638,464.6 | 566,265.4 |
| Revenue from goods manufactured | 598,237.4 | 588,453.1 | 526,211.8 |
| Expenses | 599,486.2 | 599,771.6 | 523,221.2 |
| Salaries and wages, direct and indirect labour | 84,930.2 | 80,332.8 | 73,338.2 |
| Cost of energy, water utility and vehicle fuel | 18,059.4 | 18,239.6 | 15,037.1 |
| number | |||
| Establishments | 83,596 | 84,002 | 80,335 |
| Employees, direct and indirect labour | 1,764,928 | 1,623,145 | 1,480,010 |
| $ millions | |||
| Opening inventories | 63,776.2 | 66,060.3 | 62,153.0 |
| Closing inventories | 67,267.6 | 68,931.3 | 64,214.3 |
| Manufacturing value added | 212,774.9 | 200,203.9 | 187,172.7 |
| Source: Statistics Canada, CANSIM table 301-0006. | |||
| 1991 | 2011 | 1991 to 2011 | |
|---|---|---|---|
| units | % change | ||
| Passenger cars, total | 873,184 | 691,079 | -20.9 |
| North America | 573,297 | 433,452 | -24.4 |
| Japan | 237,701 | 98,386 | -58.6 |
| Other countries | 62,186 | 159,241 | 156.1 |
| Trucks, total | 414,606 | 929,498 | 124.2 |
| North America | 347,671 | 783,041 | 125.2 |
| Source: Statistics Canada, CANSIM table 079-0003. | |||
View charts
- Date modified: