
Health

Archived Content
Information identified as archived is provided for reference, research or recordkeeping purposes. It is not subject to the Government of Canada Web Standards and has not been altered or updated since it was archived. Please "contact us" to request a format other than those available.
Tables
- Table 5 Selected health indicators, 2013
- Table 6 Life expectancy
- Table 7 Births in Canada, by age of mother
- Table 8 Mortality rates, by selected causes, 2011
Charts
Tables
| Both sexes | Males | Females | |
|---|---|---|---|
| % of population | |||
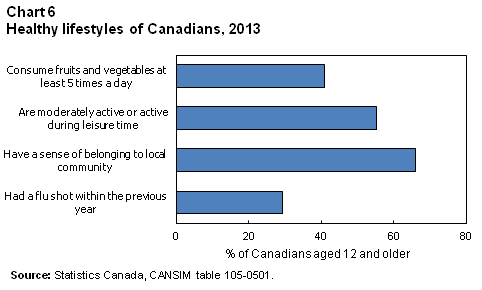
| Arthritis (15 and older) | 15.9 | 12.4 | 19.2 |
| Diabetes | 6.6 | 7.2 | 6.0 |
| Asthma | 7.9 | 6.9 | 8.9 |
| High blood pressure | 17.7 | 18.2 | 17.2 |
| Current smoker, daily or occasional | 19.3 | 22.1 | 16.5 |
| BMI (18 and older), overweight | 34.8 | 41.9 | 27.7 |
| BMI (18 and older), obese | 18.8 | 20.1 | 17.4 |
| Influenza immunization, in past year | 29.3 | 26.5 | 32.0 |
| Perceived mental health, very good or excellent | 71.1 | 71.9 | 70.3 |
| Perceived mental health, fair or poor | 6.3 | 5.8 | 6.7 |
| Life satisfaction, satisfied or very satisfied | 91.7 | 91.9 | 91.5 |
| Pain or discomfort that prevents activities | 14.7 | 12.0 | 17.3 |
| Has a regular medical doctor | 84.5 | 80.6 | 88.3 |
|
Notes: Population aged 12 and older. BMI = body mass index. Source: Statistics Canada, CANSIM table 105-0501. |
|||
| 1941 | 1960 to 1962 | 1985 to 1987 | 2009 to 2011 | |
|---|---|---|---|---|
| years | ||||
| Females | ||||
| At birth | 66.3 | 74.2 | 79.7 | 83.6 |
| At age 65 | 14.1 | 16.1 | 19.1 | 21.7 |
| Males | ||||
| At birth | 63.0 | 68.4 | 73.0 | 79.3 |
| At age 65 | 12.8 | 13.5 | 14.9 | 18.8 |
|
Note: Starting with 1950 to 1952 data, life expectancy is calculated using a three-year average of age-specific mortality rates. Sources : Statistics Canada, CANSIM table 102-0512 and Catalogue no. 84-518-X. |
||||
| 1991 | 2011Note p: preliminary | 1991 to 2011 | |
|---|---|---|---|
| number | % change | ||
| All ages | 402,533 | 377,636 | -6 |
| under 15 years | 265 | 99 | -63 |
| 15 to 19 years | 24,180 | 13,436 | -44 |
| 20 to 24 years | 80,724 | 53,478 | -34 |
| 25 to 29 years | 150,027 | 113,628 | -24 |
| 30 to 34 years | 107,561 | 124,349 | 16 |
| 35 to 39 years | 33,107 | 59,656 | 80 |
| 40 to 44 years | 4,124 | 12,207 | 196 |
| 45 to 49 years | 138 | 708 | 413 |
|
p preliminary Note: Totals include births where the age of the mother is unknown. Source: Statistics Canada, CANSIM table 102-4503. |
|||
| Both sexes | Males | Females | |
|---|---|---|---|
| rate per 100,000 population | |||
| All causes of death | 489.0 | 589.9 | 406.3 |
| Sepsis | 4.8 | 5.4 | 4.4 |
| Viral hepatitis | 1.0 | 1.3 | 0.6 |
| Human immunodeficiency virus | 0.7 | 1.1 | 0.4 |
| Malignant neoplasms | 154.1 | 182.6 | 133.1 |
| Diabetes mellitus | 14.5 | 18.4 | 11.4 |
| Alzheimer’s disease | 10.8 | 9.4 | 11.6 |
| Heart diseases | 91.0 | 119.3 | 67.6 |
| Cerebrovascular diseases | 24.8 | 26.4 | 23.2 |
| Influenza and pneumonia | 10.4 | 12.6 | 8.9 |
| Chronic lower respiratory diseases | 22.1 | 26.9 | 19.0 |
| Chronic liver disease and cirrhosis | 6.2 | 8.4 | 4.2 |
| Renal failure | 5.9 | 7.6 | 4.8 |
| Certain conditions originating in the perinatal period | 4.1 | 4.5 | 3.6 |
| Congenital malformations, deformations and chromosomal abnormalities | 2.8 | 3.0 | 2.6 |
| Accidents (unintentional injuries) | 24.2 | 32.9 | 16.1 |
| Suicide | 10.1 | 15.1 | 5.1 |
| Homicide | 1.6 | 2.2 | 0.9 |
|
Note: Rates are age-standardized to the 1991 Census of Population. Source: Statistics Canada, CANSIM table 102-0552. |
|||
Charts
- Date modified: