
Statistics Canada
www.statcan.gc.ca
Common menu bar links
Balance of international payments

Archived Content
Information identified as archived is provided for reference, research or recordkeeping purposes. It is not subject to the Government of Canada Web Standards and has not been altered or updated since it was archived. Please "contact us" to request a format other than those available.
Fourth quarter 2007
Balance of international payments note to readers
Highlights
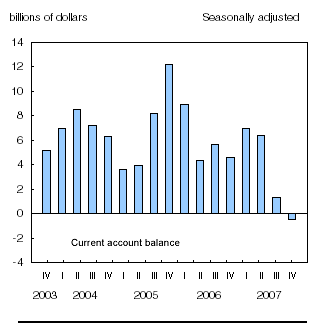
For the first time since the second quarter of 1999, the current account balance with the rest of the world was in deficit. The balance deteriorated $1.8 billion from the previous quarter to negative $513 million in the fourth quarter (on a seasonally adjusted basis). A lower goods surplus and record travel deficit contributed significantly to the emergence of this small deficit.
For 2007 as a whole, the current account surplus narrowed to $14.2 billion, down sharply from the 2006 surplus of $23.6 billion. This was led by a wider deficit on travel and higher profits earned by foreign direct investors. This narrowing surplus occurred against the backdrop of a Canadian dollar that made strong gains against major foreign currencies in 2007, particularly the American dollar and the British pound. This generally made Canada's exports more expensive and its imports cheaper, with consequence for the current account balance.
Chart D.1 Higher travel deficit and smaller goods surplus lead
to the first current account deficit in eight years
In the capital and financial account (not seasonally adjusted), robust foreign direct investment acquisitions led to near record direct investment flows into Canada. In the context of debt market reaction to the recent credit crisis, Canadian portfolio investors continued to shed large amounts of foreign debt while purchasing foreign equities for a second consecutive quarter.
Current account
Lowest goods surplus in more than 8 years
The goods surplus narrowed to $9.3 billion in the fourth quarter, below the $10 billion mark for the first time this decade, as exports fell more than imports. Nevertheless, the $1.1 billion reduction in the goods surplus was smaller than that of the previous quarter when imports advanced.
Goods exports weakened further in the fourth quarter, down $4.0 billion from the previous quarter to reach $111.4 billion. This was the third consecutive drop in sales of goods to non-residents. The largest decline was in industrial goods which fell $1.8 billion, mostly due to lower prices. Export values for nickel ores and nickel alloys were down by a combined $1.2 billion on both lower volumes and prices. Inorganic chemicals (which include uranium) lost ground for the second consecutive quarter, as prices declined 40% after the peak of the second quarter.
The exports of machinery and equipment and automotive products continued to soften in the fourth quarter. Machinery and equipment exports were off $1.1 billion from the previous quarter, with the largest reduction being recorded in telecommunication products. Exports of automotive products fell $1.0 billion in the fourth quarter recording foreign sales of $18.0 billion, the lowest level since the second quarter of 1998. The weakness was evident in automobiles, trucks, parts which all showed their lowest sales levels in several years.
Forestry products rounded out the weakness in exports in the fourth quarter, down $0.5 billion from the previous quarter. This made for the eighth consecutive decline in foreign sales of forestry products. Almost all the $0.3 billion reduction in exports of lumber came from lower prices in the fourth quarter.
Energy product exports comprised the only category that posted gains in the fourth quarter, up $1.0 billion. This was led by higher prices of crude petroleum exports. The sales of crude petroleum more than offset the reduced sales of natural gas, where prices declined in the quarter.
Import of goods declined $3.0 billion in the fourth quarter to reach $102.1 billion. For their part imports of automotive products were down $1.2 billion. In particular, vehicle parts lost more than 10% to reach $8.1 billion - the lowest level since the end of 1996.
Both industrial goods and machinery and equipment posted $0.8 billion reductions in the fourth quarter. Lower prices were responsible for these declines as volumes improved for both major categories. Imports of organic chemicals and aircraft were lower following highs set in the third quarter. Energy products edged down, as lower imports of crude petroleum were almost all offset by higher imports of petroleum and coal products.
For 2007 as a whole, the surplus on goods continued to shrink. The goods balance was down $1.7 billion as imports rose more than exports. On the export side, large gains were recorded for industrial goods and energy products while automotive products and forestry products were down. The strengthening of imports during 2007 was more evenly distributed between almost all major categories of goods, except for automotive products which remained flat due to low imports of vehicle parts.
Services deficit continues to widen
In the fourth quarter, the deficit on services set another record at $5.8 billion, up $0.8 billion from the previous quarter. That larger deficit was led by the third consecutive record for the travel deficit. The deficit on transportation also expanded, while that of commercial services was largely unchanged.
The travel deficit reached $3.6 billion during this quarter as payments continued to grow while receipts remained stable. The stronger buying power of the Canadian dollar was an important factor as Canadian travellers to the United States increased their spending by 16.7%. The number of same-day travellers was up 8.9% while the number of Canadians travelling by car and staying at least one night in United States was up 15.8%. Expenses by Canadians on overseas trips were also up marginally. On the receipts side, lower expenses by U.S. visitors were more than offset by increased spending by overseas travellers.
Chart D.2 Canadians take advantage of the stronger
dollar and increase their travel spending
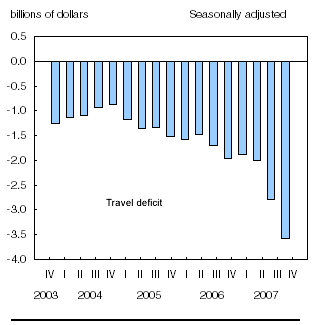
The transportation services deficit widened ($0.3 billion) to a record $2.1 billion in the fourth quarter. This was due, in part, to higher payments for passenger fares. However, the deficit on commercial services edged down ($0.2 billion) as receipts rose and payments were largely unchanged.
Deficit on investment income remains stable
The deficit on investment income narrowed marginally ($0.2 billion) as the decline in payments exceeded that of receipts. Payments on investment income were down $0.7 billion, as interest paid on Canadian bonds reached a new low of $5.2 billion. In addition, the profits earned by foreign direct investors edged down after a third quarter high.
Chart D.3 Nearly identical reductions of investment income receipts and payments leave investment income deficit largely unchanged
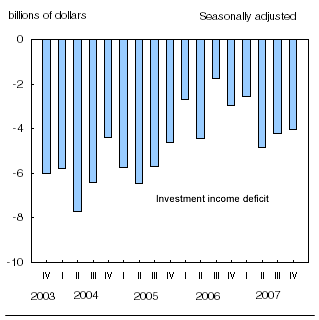
On the receipts side, profits on Canadian direct investment abroad declined $0.8 billion following a strong third quarter. Interest received on foreign portfolio investment was also down ($0.2 billion), reflecting lower yields. However, higher receipts in the other investment, mainly from banking assets, partially offset these reductions.
Financial account
Foreign direct investors close 2007 with record investment
In the fourth quarter of 2007, direct investment flows into Canada surged to $47.0 billion. Once again this was driven by foreign acquisitions of Canadian firms, a trend that has dominated 2007. Takeovers of Canadian firms by foreign direct investors comprised over 80% of this quarter's inward direct investment.
Chart D.4 Takeovers drive foreign direct investment
in Canada to new high
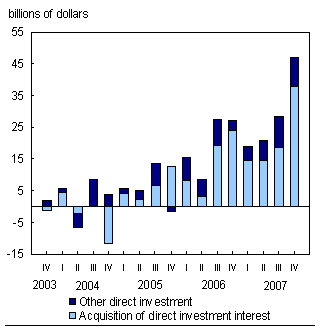
Foreign direct investment was concentrated in the energy and metallic minerals sector of the Canadian economy ($35.2 billion) in the fourth quarter. On a geographical basis, most of the foreign financing came from British ($27.4 billion) and American ($17.2 billion) firms.
The year 2007 as a whole produced an unprecedented $115.4 billion of foreign direct investment flows into Canada, surpassing the wave of inward investment realized during the tech bubble of 2000. Cross-border mergers and acquisitions were the driving force behind foreign direct investment in Canada in 2007, reflecting consolidation of some sectors on a worldwide scale.
Non-resident holdings of Canadian portfolio shares drop sharply
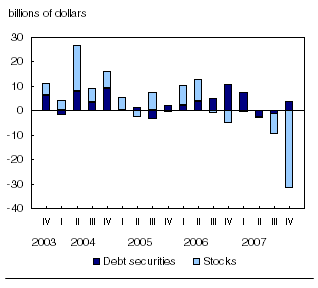
Foreign portfolio investors reduced their holdings of Canadian securities by a record $28.0 billion during the fourth quarter, mainly equities. The sizable inflow of foreign direct investment capital used to acquire Canadian firms in the fourth quarter was partly offset by the relinquishing of significant quantities of shares formerly held by foreign portfolio investors. Foreign holdings of Canadian equities fell sharply ($31.9 billion), mainly related to takeovers.
Sales of $1.1 billion of Canadian outstanding shares by non-residents during the quarter also contributed to the decline in the foreign portfolio holdings. While non-residents were net buyers of Canadian outstanding shares during the year overall ($2.3 billion), it marked a dramatic slowdown in foreign investment in these instruments relative to previous years.
Non-resident investors picked up $4.4 billion worth of Canadian bonds during the fourth quarter of 2007, after bond investment fell in the second quarter and remained flat in the third. Purchases were concentrated in federal government enterprise bonds, reflecting record new issues in foreign markets over the quarter. Foreign investors purchased $9.5 billion of Canadian bonds in 2007, the majority in U.S. dollar-denominated Canadian bonds, a reversal from 2006 when Canadian dollar issues were favoured.
Non-residents continued to shy away from Canadian money market paper in the fourth quarter, removing a further $568 million worth from their portfolios. Divestment was entirely in federal government and federal government enterprise paper. For the year, foreign investors sold off $1.4 billion worth of Canadian money market paper, the majority being federal government issues.
Chart D.5 Takeovers lead to significant reductions of foreign-held
Canadian shares
Canadian direct investment abroad advances steadily
Canadian direct investment abroad reached $13.4 billion in the fourth quarter, up marginally from the third quarter and equivalent to the average quarterly investment for the year. The bulk of the investment in the fourth quarter ($10.1 billion) was the result of additional working capital provided to foreign affiliates. Continuing the pattern of previous quarters of 2007, most of the investment ($8.0 billion) in the fourth quarter was in the finance and insurance industry and was directed to the U.S. economy ($6.0 billion).
Chart D.6 Direct investment abroad continues at the same pace1
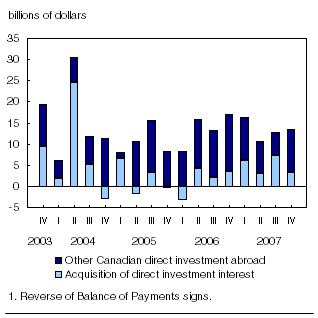
Canadian direct investors placed $53.1 billion into foreign economies in 2007. The solid pace of investment observed in 2007 was sizable by historical standards (fourth largest). The Canadian dollar appreciated by over U.S. 15 cents in 2007 to slightly exceed parity with the U.S. dollar at year-end.
Canada had been an annual net provider of foreign direct investment to the rest of the world from 2001 to 2005. This changed in 2006, with inward investment surpassing outward investment, and widened further in 2007.
Canadian investors demand for foreign securities rebounds
After an atypical decline in the third quarter, Canadian investors demand for foreign securities rebounded in the fourth quarter, with investment in equity markets dominating. The $2.8 billion invested in the fourth quarter brought the total for the year to $45.9 billion, well below the $78.7 billion worth of foreign securities acquired in 2006.
Chart D.7 Equities drive Canadian demand for foreign securities1
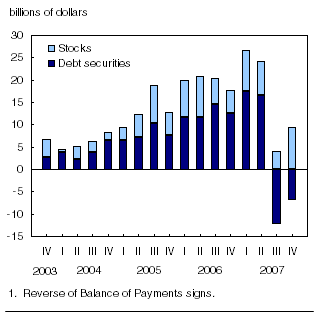
Canadians invested $9.5 billion in foreign equities during the quarter, the largest amount in over six years. Investments were focused primarily in U.S. stocks ($7.8 billion), as has been the case for the entire year. The $30.6 billion in purchases of foreign shares in 2007 were up 8.0% over 2006, amounting to the highest foreign equity activity since 2001.
In a marked turnaround from the first half of the year in which Canadians invested record amounts in foreign bonds, they divested a sizable $6.8 billion worth during the second half of the year, with most ($5.1 billion) over the fourth quarter. Canadian investors bought $26.7 billion of foreign bonds in 2007, down from the 2006 high of $43.6 billion.
Following a record divestment of $10.4 billion in the third quarter, Canadians offloaded a further $1.5 billion of their holdings of foreign short-term market paper in the fourth quarter, the bulk in non-U.S. paper. In a year characterized by instability in the short term debt market, Canadians more than halved their holdings of foreign money market instruments in 2007.
Transactions in deposits, loans and reserve assets
The other investment account recorded a net inflow of $3.3 billion over the quarter. Most of the inflow of the quarter was the result of increased loan and deposit liabilities to non-residents. Contributing to the inflow were moderate decreases in loan and international reserve assets.
In a year marked by high volatility in the debt market and a 17.6% appreciation of the Canadian dollar over the U.S. dollar, major increases were recorded in deposits abroad by residents ($39.2 billion) and deposits in Canada by non-residents ($48.6 billion).
Data tables
Information on methods and data quality available in the Integrated Meta Data Base: 1534, 1535 and 1536.