
Map 2.5
Average annual evapotranspiration, 1981 to 2010
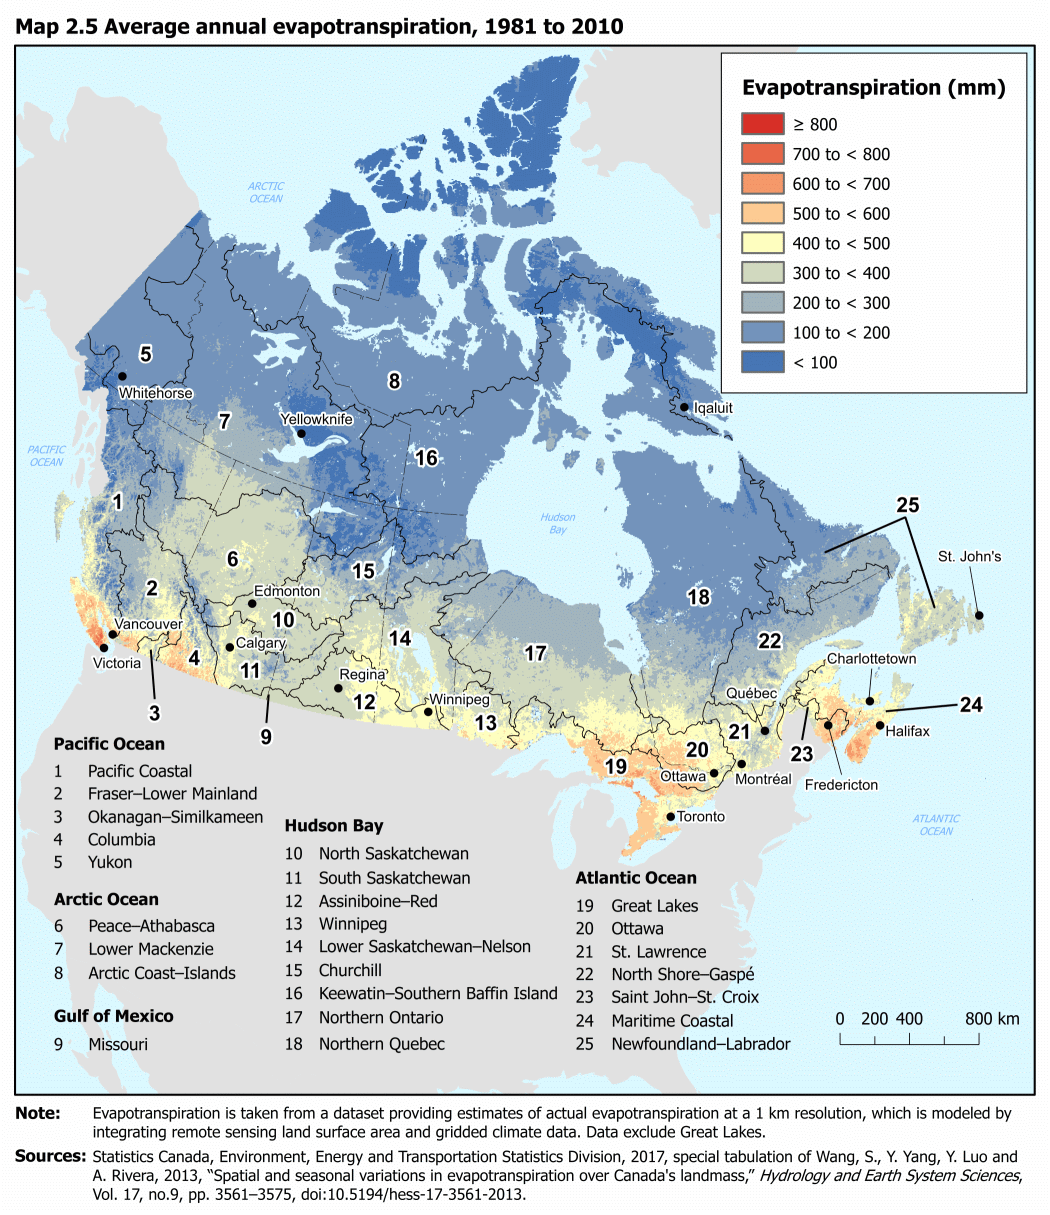
Description for Map 2.5
The title of this map is "Average annual evapotranspiration, 1981 to 2010." On this map, evapotranspiration is measured in millimeters (mm) for each drainage region. Category 1 (red) is greater than or equal to 800 mm, Category 2 (dark orange) is 700 mm to less than 800 mm, Category 3 (medium orange) is 600 mm to less than 700 mm, Category 4 (light orange) is 500 mm to less than 600 mm, Category 5 (pale yellow) is 400 mm to less than 500 mm, Category 6 (light olive green) is 300 mm to less than 400 mm, Category 7 (medium grey) is 200 mm to 300 mm, Category 8 (slate blue) is 100 mm to less than 200 mm and Category 9 (dark blue) represents evapotranspiration less than 100 mm.
The highest average annual volumes of water lost to evapotranspiration from 1981 to 2010 occurred in the Great Lakes, Saint-John–St. Croix, Maritime Coastal, Ottawa, Okanagan–Similkameen, Columbia, Winnipeg, Assiniboine–Red and St. Lawrence drainage regions. The lowest values occurred in the North.
Each drainage region boundary is outlined in black and labeled with a number to identify the area. A table is included which provides the full name of each drainage region, grouped by ocean drainage areas. The locations and names of some major cities in each province and territory are included on the map. Land areas outside of Canada are coloured light grey. Water is pale blue and major bodies, like oceans and bays, are named.
Note: Evapotranspiration is taken from a dataset providing estimates of actual evapotranspiration at a 1 km resolution, which is modeled by integrating remote sensing land surface data and gridded climate data. Data exclude the Great Lakes.
Sources: Statistics Canada, Environment, Energy and Transportation Statistics Division, 2017, special tabulation of Wang, S., Y. Yang, Y. Luo and A. Rivera, 2013, "Spatial and seasonal variations in evapotranspiration over Canada's landmass," Hydrology and Earth System Sciences, Vol. 17, no. 9, pp. 3561–3575, doi:10.5194/hess-17-3561-2013.
| Category | Millimetres | Colour |
|---|---|---|
| 1 | ≥ 800 | Red |
| 2 | 700 to < 800 | Dark orange |
| 3 | 600 to < 700 | Medium orange |
| 4 | 500 to < 600 | Light orange |
| 5 | 400 to < 500 | Pale yellow |
| 6 | 300 to < 400 | Light olive green |
| 7 | 200 to < 300 | Medium grey |
| 8 | 100 to < 200 | Slate blue |
| 9 | < 100 | Dark blue |
| Ocean drainage areas and drainage regions | Code | Average annual evapotranspiration |
|---|---|---|
| number | millimetres | |
| Pacific Ocean | ||
| Pacific Coastal | 1 | 261 |
| Fraser–Lower Mainland | 2 | 328 |
| Okanagan–Similkameen | 3 | 412 |
| Columbia | 4 | 412 |
| Yukon | 5 | 141 |
| Arctic Ocean | ||
| Peace–Athabasca | 6 | 314 |
| Lower Mackenzie | 7 | 168 |
| Arctic Coast–Islands | 8 | 108 |
| Gulf of Mexico | ||
| Missouri | 9 | 334 |
| Hudson Bay | ||
| North Saskatchewan | 10 | 343 |
| South Saskatchewan | 11 | 339 |
| Assiniboine–Red | 12 | 393 |
| Winnipeg | 13 | 399 |
| Lower Saskatchewan–Nelson | 14 | 319 |
| Churchill | 15 | 243 |
| Keewatin–Southern Baffin Island | 16 | 131 |
| Northern Ontario | 17 | 310 |
| Northern Quebec | 18 | 178 |
| Atlantic Ocean | ||
| Great Lakes | 19 | 481 |
| Ottawa | 20 | 468 |
| St. Lawrence | 21 | 386 |
| North Shore–Gaspé | 22 | 270 |
| Saint John–St. Croix | 23 | 478 |
| Maritime Coastal | 24 | 472 |
| Newfoundland–Labrador | 25 | 225 |
- Date modified: