Map 2.6
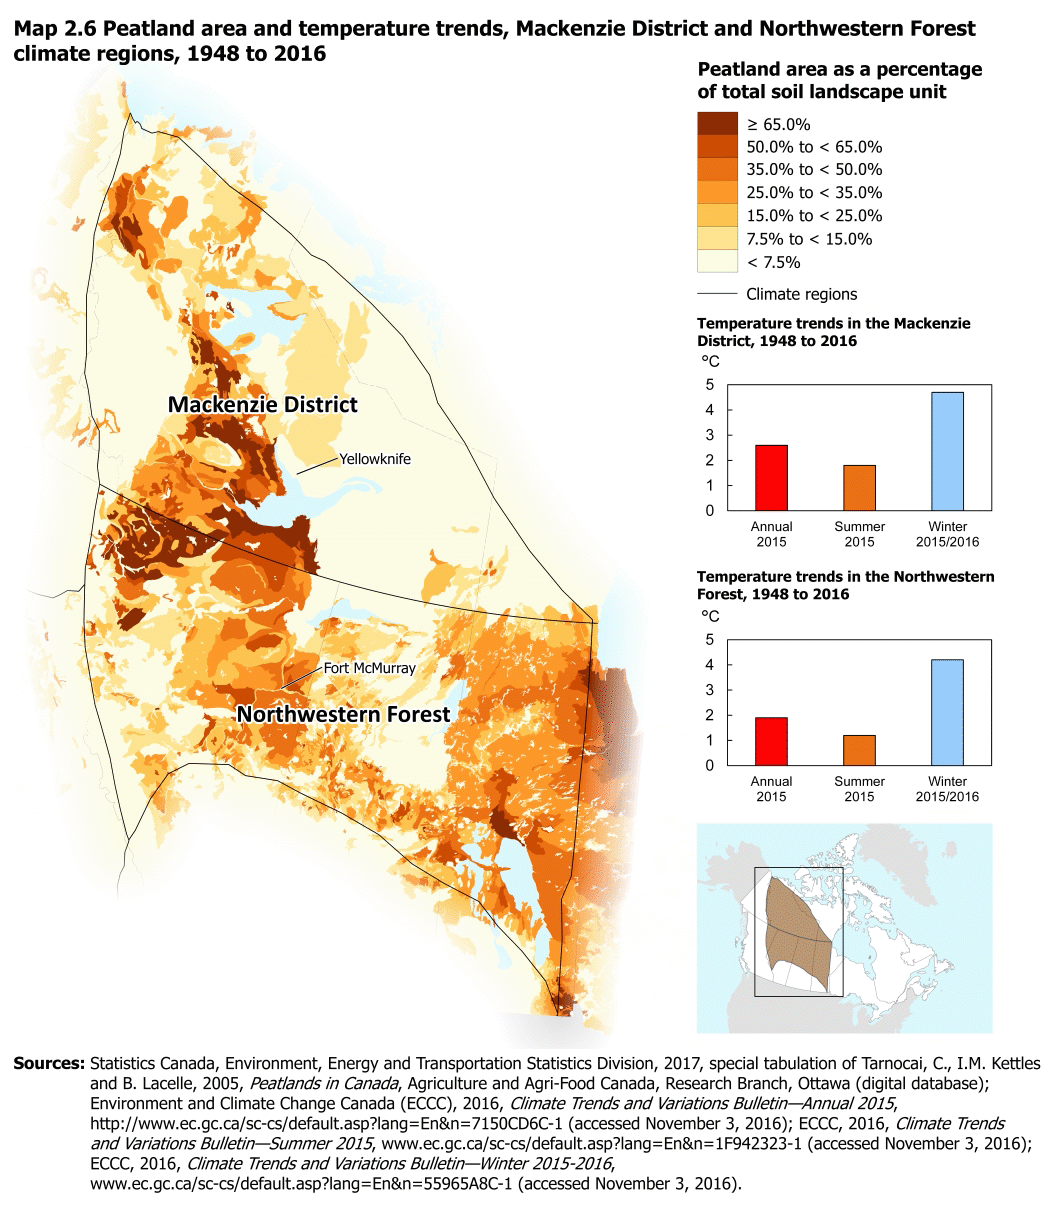
Peatland area and temperature trends, Mackenzie District and Northwestern Forest climate regions, 1948 to 2016

Description for Map 2.6
The title of this map is "Peatland area and temperature trends, Mackenzie District and Northwestern Forest climate regions, 1948 to 2016." It includes two main components: a map on peatland area and a sidebar to the right of the map image that includes a legend, two charts on temperature trends and an inset map showing the location of the climate regions. The charts are titled "Temperature trends in the Mackenzie District, 1948 to 2016" and "Temperature trends in the Northwestern Forest, 1948 to 2016."
On this map, the darker the colour, the greater the peatland area as a percentage of the total soil landscape unit. Category 1 (dark rust) is greater than or equal to 65.0% of the soil landscape unit, Category 2 (dark orange) is 50.0% to less than 65.0% of the soil landscape unit, Category 3 (medium orange) is 35% to less than 50% of the soil landscape unit, Category 4 (medium-light orange) is 25% to less than 35% of the soil landscape unit, Category 5 (light orange) is 15% to less than 25% of the soil landscape unit, Category 6 (very light orange) is 7.5% to less than 15% of the soil landscape unit and Category 7 (pale yellow) is less than 7.5% of the soil landscape unit.
Climate region boundaries are indicated by a thin black line and the inset map locates the regions within north-central Canada, extending across Manitoba, Saskatchewan, Alberta and north into the Northwest Territories and a small part of Nunavut.
Climate region names are indicated, as well as the location and name of Yellowknife in the Mackenzie District and Fort McMurray in Northwestern Forest climate regions. Water is pale blue.
Sources: Statistics Canada, Environment, Energy and Transportation Statistics Division, 2017, special tabulation of Tarnocai, C., I.M. Kettles and B. Lacelle, 2005, Peatlands of Canada, Agriculture and Agri-Food Canada, Research Branch, Ottawa (digital database); Environment and Climate Change Canada (ECCC), 2016, Climate Trends and Variations Bulletin—Annual 2015, (accessed November 3, 2016); ECCC, 2016, Climate Trends and Variations Bulletin—Summer 2015, (accessed November 3, 2016); ECCC, 2016, Climate Trends and Variations Bulletin—Winter 2015-2016, (accessed November 3, 2016).
| Annual 2015 | Summer 2015 | Winter 2015/2016 | |
|---|---|---|---|
| degrees Celsius | |||
| Northwestern Forest | 1.9 | 1.2 | 4.2 |
| Annual 2015 | Summer 2015 | Winter 2015/2016 | |
|---|---|---|---|
| degrees Celsius | |||
| Mackenzie District | 2.6 | 1.8 | 4.7 |
| Category | Percentage | Colour |
|---|---|---|
| 1 | ≥ 65.0% | Dark rust |
| 2 | 50.0% < 65.0% | Dark orange |
| 3 | 35.0% < 50.0% | Medium orange |
| 4 | 25.0% < 35.0% | Medium-light orange |
| 5 | 15.0% < 25.0% | Light orange |
| 6 | 7.5% < 15.0% | Very light orange |
| 7 | < 7.5% | Pale yellow |
- Date modified: