
Publications
Households and the Environment Survey – Elementary level teacher's kit
Theme 1: Water Use and Conservation

Archived Content
Information identified as archived is provided for reference, research or recordkeeping purposes. It is not subject to the Government of Canada Web Standards and has not been altered or updated since it was archived. Please "contact us" to request a format other than those available.
- Overview
- Theme Rubric
- Lesson 1: Where Does Your Water Come From?
- Lesson 2: Drinking Water
- Lesson 3: Flushed Away
- Lesson 4: Conserving Water Outside
Overview:
Information from Statistics Canada’s 2011 Households and the Environment Survey revealed that the conservation of water is a significant issue for Canadians.
In this theme, students will think about the way they use water on a daily basis and the impact of those habits on the environment. They will investigate the source of water they use in their community and consider different ways in which it is used. They will think critically about using bottled water, and explore methods of conserving water as a useful resource both inside and outside.
Suggested Grade Level:
- Grades 1-3
Topics:
- Mathematics
- Social Studies
- Science and Technology
Cross-curricular Connections:
- Language Arts
- Arts
Materials:
Lesson 1: Where Does your Water Come From?
- Simplified Survey Data: Water Supply by Province
- Print or digital map of region
- Water Source Map
Lesson 2: Drinking Water
- Simplified Survey Data: Bottled Water
- Handout: Comparison Worksheet
- Clean, plastic reusable cups
- Tap water and bottled water
Lesson 3: Flushed Away
- Simplified Survey Data: Low-volume Toilets
- Handout: Flushed Away Survey
- Handout: Flushed Away Investigation
- Large clear plastic bins or buckets
- 1 litre pitcher
Lesson 4: Conserving Water Outside
- Simplified Survey Data: Lawn Ownership
- Simplified Survey Data: Rain Barrels and Cisterns
- Chart paper or graph paper
- Markers, pencils or crayons
Theme: Water Use and Conservation
- Rubric: Water Use and Conservation
Assignments:
- Create a bar graph of water supply data.
- Create a line plot of bottled water use over time.
- Complete a Venn diagram of advantages and disadvantages of bottled or tap water.
- Complete an investigation of water quantity, in litres.
- Create a map of green spaces in the community.
Theme Rubric
| Level 1 | Level 2 | Level 3 | Level 4 |
|---|---|---|---|
| Collects, organizes and displays data with little attention to detail. | Collects, organizes and displays data with some attention to detail. | Collects, organizes and displays data with consistent attention to detail. | Collects, organizes and displays data with exceptional attention to detail. |
| Extracts information with support. | Extracts information and draws some conclusions with support. | Independently extracts information and draws general conclusions. | Independently extracts detailed information and draws in-depth conclusions. |
| Identifies general connections between natural and built environment, and how people live. | Identifies general connections between natural and built environments, and how people live, with some evidence. | Describes connections between natural and built environments, and how people live, with evidence. | Describes connections between natural and built environment, and how people live, with strong evidence. |
| Extracts general or isolated information from maps. | Extracts information and draws general conclusions from maps. | Extracts information and draws thoughtful conclusions from maps. | Extracts detailed information and draws sophisticated conclusions from maps. |
| Identifies ways in which people use water to meet basic needs. | Describes ways in which people use water to meet basic needs and demonstrates some reflection on the impact of these practices. | Describes ways in which people use water to meet basic needs and demonstrates careful reflection on the impact of these practices. | Describes ways in which people use water to meet basic needs and demonstrates insightful reflection on the impact of these practices. |
Lesson 1: Where Does Your Water Come From?
Lesson
Estimated Completion Time: 1+ hours
Learning Objectives:
Mathematics:
- Collect and organize discrete primary data.
- Display data in a graph with appropriate titles and labels.
Social Studies:
- Extract information from a map about location and physical characteristics of a region.
- Describe connections between features of the natural environment of a region and the type of land use in that region.
- Gather and organize information on the interrelationship between people and the natural and built features of their community.
- Describe similarities and differences between their community and a community in a different region.
Science and Technology:
- Identify examples of water in the natural and built environment and describe ways that water is obtained.
Assignments:
- Create a bar graph of water supply data.
Activity:
Begin by brainstorming with the class. Ask them to think about how the water they use to drink and wash gets to the tap in their homes. Where does it come from?
Some possible answers may include:
- Pipes
- Underground tunnels
- Oceans
- Lakes
- Rivers
- Ponds
- Rain
Ask students to identify the most likely source of the water in their community. If possible, show them a map of their province and identify bodies of water. Help students to identify their own community and talk about bodies of water in and around their region. Discuss general characteristics about the community, such as its size, local industries that might involve water, and the types of buildings that would use water in the community.
Guiding Questions:
- How many people live in your community?
- Would you describe your community as “rural” or “urban”?
- How do we use water each day?
- Is your community located on a body of water? If so, which one?
- Does your community get its water from that body of water? If not, where does the water come from?
Hint: Some schools will have a mix of students from rural and urban areas. If this is the case, survey students to determine the type of community in which they live.
Use Simplified Survey Data: Water Supply by Province or the data from the Statistics Canada’s 2011 Households and the Environment Survey to create a bar graph that represents how water is provided to households in their home-province (municipal or well).
Complete a survey in the class, asking students where the water in their house comes from, and create a bar graph to compare with the Water Supply by Province table (below).
Hint: Students may need to ask parents or guardians about the source of their water.
Rural and urban communities will have different requirements for water use. Discuss and investigate why some communities may get their water from a different source than other communities in the same province.
- Have the students identify a use for water that is common in a rural community that might not be as common in an urban community, such as watering crops on a farm.
- Have the students identify a use for water that is common in an urban community that might not be as common in a rural community, such as providing a water source for fire hydrants.
Hint: Environment Canada has created a map that shows the source of water supply for different areas. This can help students understand from which body of water their drinking water comes.
Water Source Map
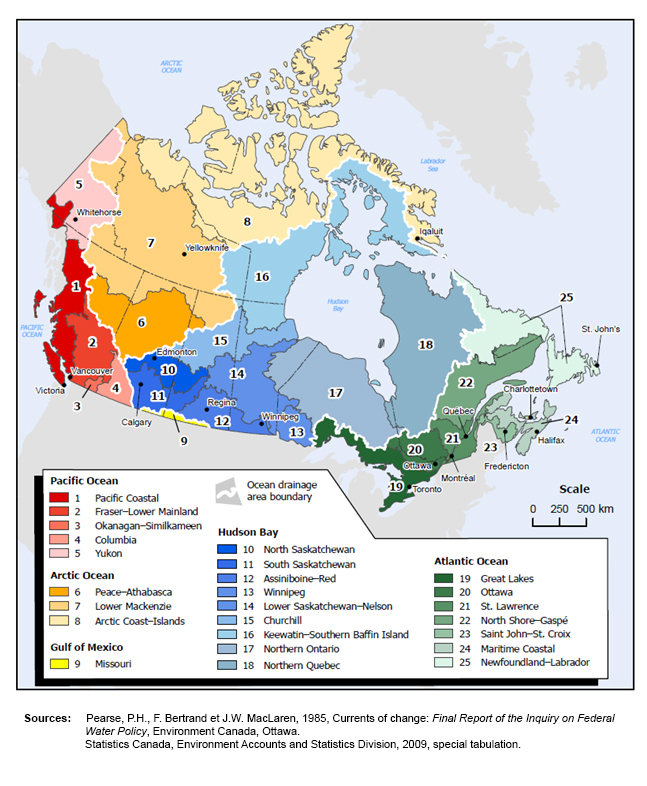
Description for Water Source Map
Simplified Survey Data: Water Supply by Province
Where do people in Canada get their water? Does it come from a well or from a municipal supply?
This table shows how many households in Canada and in each province get the water for their homes from a municipal supply or from a well.
Each data point has been adjusted to show the information as if the total population was a group of ten households.
| Area | Municipal Water Supply | Well Water |
|---|---|---|
| Canada | 9/10 Households | 1/10 Households |
| Newfoundland and Labrador | 9/10 Households | 1/10 Households |
| Prince Edward Island | 5/10 Households | 5/10 Households |
| Nova Scotia | 6/10 Households | 4/10 Households |
| New Brunswick | 6/10 Households | 4/10 Households |
| Quebec | 9/10 Households | 1/10 Households |
| Ontario | 9/10 Households | 1/10 Households |
| Manitoba | 9/10 Households | 1/10 Households |
| Saskatchewan | 9/10 Households | 1/10 Households |
| Alberta | 9/10 Households | 1/10 Households |
| British Columbia | 9/10 Households | 1/10 Households |
Lesson 2: Drinking Water
Lesson
Estimated Completion Time: 2+ hours
Learning Objectives:
Mathematics:
- Gather data to answer a question, using a simple survey with a limited number of responses.
- Display data in a line plot with appropriate titles and labels.
- Pose and answer questions about simple line plots and tally charts.
Science and Technology:
- Assess personal and family uses of water as “more efficient” or “less efficient”.
Language Arts:
- Sort ideas and information with support and direction using a graphic organizer.
Assignment:
- Create a line plot of bottled water use over time.
- Complete a Venn diagram of advantages and disadvantages of bottled or tap water.
Activity:
Begin this lesson by conducting a survey to determine the number of students who usually drink bottled water at home. Track the response to the survey on the board and have the class calculate how many students usually drink bottled water at home and how many usually drink tap water.
Next, conduct a blind taste-test with the class. This can be done at a centre or as a class. Without letting students see, fill two clean, reusable plastic cups for each person to try. Label the cups with tap water “1” and the cups with bottled water “2.” Have students taste the water from each cup and decide which, if either, tastes better. Provide students with a method of response, such as a slip of paper with check boxes, or an opaque container in which they can drop a bead or counting chip to indicate their response. Response options should include:
- The water in Cup 1 tastes better.
- The water in Cup 2 tastes better.
- The water in Cups 1 and 2 tastes the same
Count and tally the results and then reveal to the class which type of water was in which cup. Discuss the results with the students as a class. Are they surprised?
Next, using the Simplified Survey Data: Bottled Water or the data from the Statistics Canada’s Households and the Environment Survey to review information from 2006, 2007, 2009, and 2011, have students use this information and create a line-plot that visually represents the trend in bottled water consumption for their home-province over several years. Have students identify which year people in their province drank the most and the least bottled water.
After completing their line plots, have students consider reasons why bottled water might be more or less popular at different times. Encourage students to ask questions and contemplate the advantages and disadvantages of using bottled water by completing a Venn diagram.
Guiding Questions:
- Is bottled water becoming more or less popular over time? Why do you think this is?
- What do you think the graph will show for this year?
- What factors could make someone decide to drink more or less bottled water?
- Do you think bottled water is a nice-to-have or a need-to-have item?
- Is there a situation when bottled water is a need-to-have?
Finally, have students write a journal entry or create an illustration to show when they think it is a good time to use bottled water or tap water. These can be posted around the classroom or shared with the school community.
Simplified Survey Data: Bottled Water
Who drinks bottled water and who drinks tap water? Which is more popular?
This table shows how many households in Canada and in each province drink tap water and bottled water over a period of four years.
Each data point has been adjusted to show the information as if the total population was a group of ten households. If you see a T, it means one household from a group of ten households drank primarily tap water. If you see a B, it means one household from a group of ten households drank primarily bottled water.
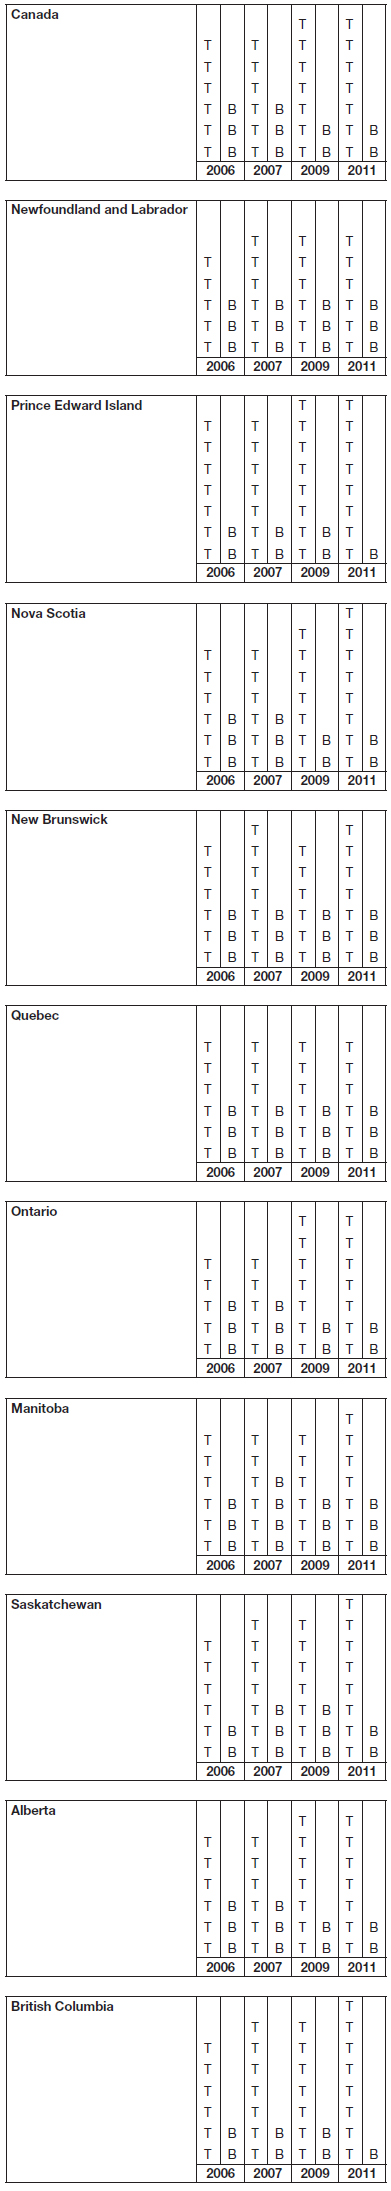
Description for Simplified Survey: Data Bottled Water
Handout: Comparison Worksheet
Name:
Date:
This diagram shows the advantages and disadvantages of _____________ water.
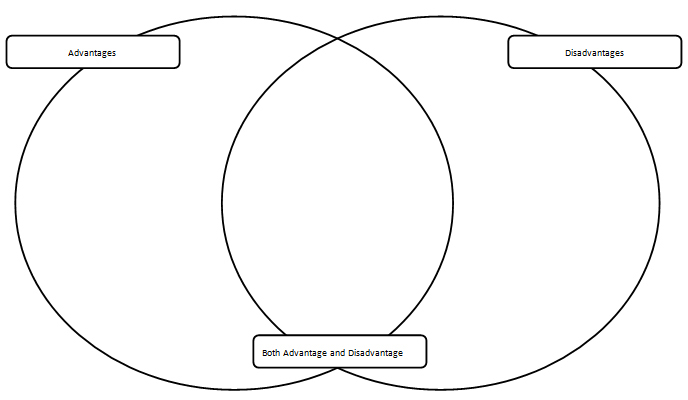
Description for Handout: Comparison Worksheet
Lesson 3: Flushed Away
Lesson
Estimated Completion Time: 2+ hours
Learning Objectives:
Mathematics
- Gather data to answer a question, using a simple survey with a limited number of responses.
- Estimate, measure and record the capacity of containers using the standard unit of litre or parts of a litre.
Social Studies
- Demonstrate an understanding of the importance of sustainability in people’s interrelationship with their natural environment.
Science and Technology
- Assess the ways in which liquids in the home are used and disposed of in terms of the effect on the health of the environment.
- Assess personal and family uses of water as responsible/efficient or wasteful.
Assignment:
- Complete investigation of water quantity in litres.
Activity:
Before teaching this lesson, send students home with Handout: Flushed Away Survey. The handout has three copies of the same survey that can be reproduced and cut along the dotted line. Students may need to ask for parent or guardian assistance in completing their survey.
Prompt students to guess how much water is used each time the toilet is flushed and record their ideas on the board, encourage students to provide estimates of comparable volumes of liquid using everyday objects (e.g., 20 juice boxes, one garbage pail).
Have the class discuss the difference between low-volume and standard-volume toilets and identify how they think this difference might impact the amount of water they use every day. Use the Simplified Survey Data: Low-volume Toilets or the data from the Statistics Canada’s 2011 Households and the Environment Survey to talk about how many households now use a low-volume toilet.
Survey the students to determine the prevalence of low-volume toilets in their homes (using the surveys they have completed at home). Have students visually represent the data using a pictograph or simple bar graph and compare the results to their home-province and the national average. Have students make a bar graph to represent this information.
Guiding Questions:
- Is the number of households with low-volume toilets in our class greater than or less than the number of households with low-volume toilets in other provinces?
- What is the difference between low-volume and standard toilets?
- How do you think this difference might affect the environment?
Next, help students perform an investigation to better understand how much water is used each day by the different types of toilets. If possible, perform the experiment outside where things can get a little soggy. This activity can also be completed at a centre.
Place two large, clear plastic bins where they are visible to all. Label one bin “Standard-volume” and one bin “Low-volume.” Have students predict how much water is used and mark the predicted levels on the outside of the bin using masking tape. Use a 1 litre pitcher to fill the containers, one at a time and encourage students to count with you.
Have students complete the Handout: Flushed Away Investigation Worksheet. Encourage students to consider how much water would be “flushed” by each person in one day or by the class as a whole in one day and brainstorm how the savings in water could be used
Note: The numbers have been left off the measure of water to allow educators to adjust the measurement scale to their students’ needs.
Encourage students to brainstorm other ways to conserve water in their daily lives.
Simplified Survey Data: Low-volume Toilets
How many people have low-volume toilets in their homes?
This table shows how many households in Canada and in each province own a low-volume toilet in 2011.
Each icon represents one household out of ten, therefore, if
you see this:  , it means one household from a
group of ten households has a low-volume toilet.
, it means one household from a
group of ten households has a low-volume toilet.
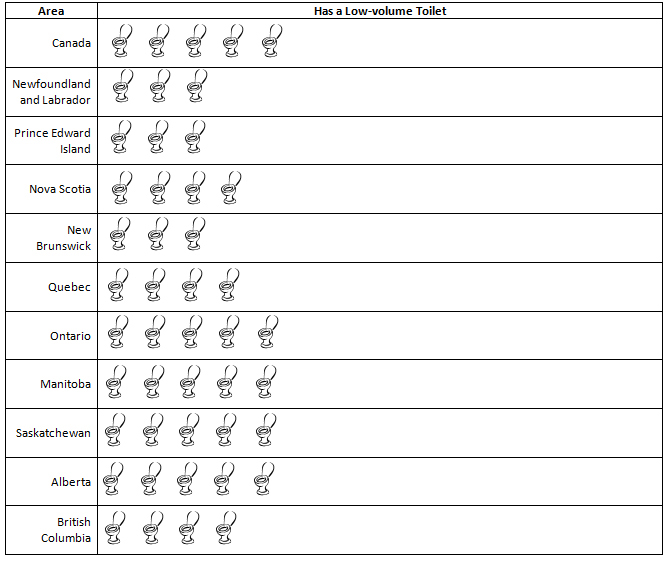
Description for Simplified Survey Data: Low-volume Toilets
Handout: Flushed Away Survey
Survey Questions: Use pictures, numbers or words to answer the survey questions:
- How many toilets do you have in your home?
- How many toilets in your home are “low-volume” toilets?
- How many toilets in your home are “standard-volume” toilets?
Handout: Flushed Away Investigation Worksheet
- Colour the picture to show how many litres of water the toilets use each time they flush.
- How much water can you save by using a low-volume toilet?
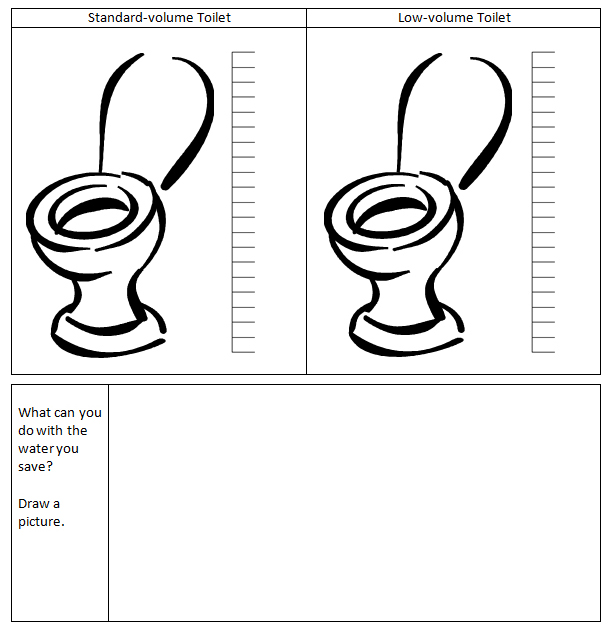
Description for Handout: Flushed Away Investigation Worksheet
Lesson 4: Conserving Water Outside
Lesson
Estimated Completion Time: 2+ hours
Learning Objectives:
Mathematics:
- Demonstrate an understanding of data displayed in a graph.
Social Studies:
- Construct simple maps that show some different land uses within a region.
- Use appropriate elements of a map including standard units of measurement and a legend.
- Describe connections between features of the natural environment of a region and the type of land use in that region.
Science and Technology:
- Apply knowledge of the water cycle.
Assignment:
- Create a map of green spaces in the community.
Activity:
Have students brainstorm some common outdoor uses for water, such as watering a lawn or garden. Briefly review the stages of the water cycle, including evaporation, transpiration, condensation, precipitation and collection.
Guiding Questions:
- How do we use water outside?
- Why do we need to think carefully about the water we use outside?
- Are there times of the year when there is too much or not enough water outside?
Focus students’ attention on the green space in their community (parks, grassy areas, gardens, etc.) and talk about who is responsible for caring for these green spaces. Ask students to think about the area immediately around their homes and complete a survey to determine how many students have a lawn and how many students have a public green space where they like to play.
Use the Simplified Survey Data: Lawn Ownership or the data from Statistics Canada’s 2011 Households and the Environment Survey to find how many households in Canada and in their home-province have a lawn. Compare this with the statistics in their own class and talk about why the rates of lawn ownership in their classroom may be different from the rest of their province (e.g., We live in a city but most people in our province live in small towns. We live in a place where the ground is very rocky. We have tall trees around our house instead of a lawn.)
Use large chart paper, graph paper, or digital design tools to have students create a map of different kinds of green space around their homes or schools. Have them conduct an investigation or interviews as a class to determine how that green space is watered and add appropriate icons to their map to show how it is watered, such as a picture of a hose, sprinkler, rain barrel, or cistern. Talk about why it is important to pay attention to how much water we use outside. Ask students to think about the water cycle and different times of the year or natural events that would make this important to do.
Help the class to select a nearby green space, such as a school garden or grassy area. Ask them to imagine and draw a picture of an invention that would help them collect precipitation to water it. Have students share their ideas and then show them a picture of a rain barrel or cistern. As a class, talk about how it works to collect and use water. Compare it with the students’ invention ideas and talk about how it is similar or different.
Use the Simplified Survey Data: Rain Barrels and Cisterns or the data from Statistics Canada’s 2011 Households and the Environment Survey to find how many households in their home-province have a rain barrel or cistern at home. Complete the same survey in the class to determine how many students have a rain barrel or cistern to collect water. Talk about reasons why some homes may or may not have one (e.g., We live in an apartment building. We don’t have a garden to water. We use the hose.)
If possible, have students set up a rain barrel or cistern at the school, track water levels at different times of the year, and work with students to determine a beneficial use for the water collected.
Simplified Survey Data: Lawn Ownership
How many people have a lawn where they live?
This graph shows how many households in each province own a lawn, and how many do not in 2011.
Each unit on the graph represents one household of a group of ten households.
Description for How many households have a lawn?
Simplified Survey Data: Rain Barrels and Cisterns
How many people use a rain barrel or cistern to collect water?
This graph shows how many households that were not in apartments in each province that used a rain barrel or cistern in 2011. Each unit on the graph represents one household of a group of ten households.
Description for How many households have a rain barrel or cistern?
- Date modified: