
Labour Force Information
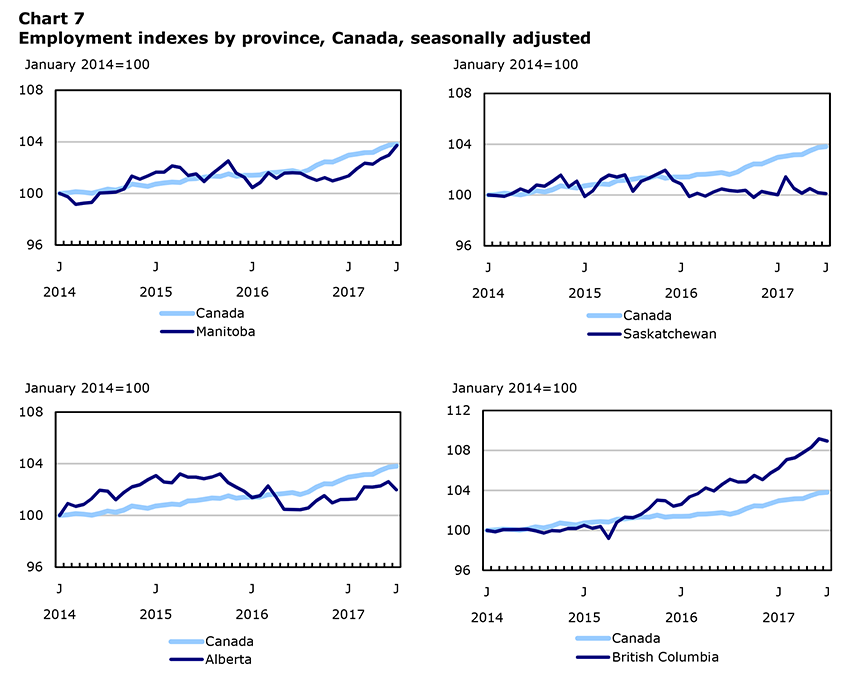
Chart 7

Archived Content
Information identified as archived is provided for reference, research or recordkeeping purposes. It is not subject to the Government of Canada Web Standards and has not been altered or updated since it was archived. Please "contact us" to request a format other than those available.
Description for Chart 7
Chart 7 contains 4 smaller charts which are derived from the data table below.
| Employment by province | |||||
|---|---|---|---|---|---|
| Canada | Manitoba | Saskatchewan | Alberta | British Columbia | |
| January 2014=100 | |||||
| January 2014 | 100.00 | 100.00 | 100.00 | 100.00 | 100.00 |
| February 2014 | 100.05 | 99.74 | 99.95 | 100.92 | 99.87 |
| March 2014 | 100.14 | 99.15 | 99.89 | 100.70 | 100.07 |
| April 2014 | 100.09 | 99.25 | 100.12 | 100.85 | 100.07 |
| May 2014 | 100.02 | 99.30 | 100.48 | 101.31 | 100.09 |
| June 2014 | 100.16 | 100.03 | 100.25 | 101.95 | 100.12 |
| July 2014 | 100.34 | 100.06 | 100.78 | 101.88 | 99.96 |
| August 2014 | 100.25 | 100.11 | 100.69 | 101.22 | 99.72 |
| September 2014 | 100.42 | 100.34 | 101.09 | 101.77 | 99.98 |
| October 2014 | 100.73 | 101.34 | 101.57 | 102.21 | 99.93 |
| November 2014 | 100.64 | 101.10 | 100.65 | 102.38 | 100.19 |
| December 2014 | 100.55 | 101.36 | 101.09 | 102.77 | 100.19 |
| January 2015 | 100.73 | 101.65 | 99.88 | 103.08 | 100.50 |
| February 2015 | 100.81 | 101.65 | 100.33 | 102.58 | 100.22 |
| March 2015 | 100.88 | 102.13 | 101.20 | 102.53 | 100.39 |
| April 2015 | 100.84 | 102.01 | 101.57 | 103.21 | 99.19 |
| May 2015 | 101.12 | 101.39 | 101.41 | 102.97 | 100.80 |
| June 2015 | 101.15 | 101.52 | 101.59 | 102.96 | 101.33 |
| July 2015 | 101.25 | 100.93 | 100.30 | 102.85 | 101.27 |
| August 2015 | 101.35 | 101.53 | 101.08 | 102.98 | 101.60 |
| September 2015 | 101.32 | 102.01 | 101.34 | 103.21 | 102.21 |
| October 2015 | 101.52 | 102.52 | 101.64 | 102.54 | 103.02 |
| November 2015 | 101.33 | 101.57 | 101.96 | 102.20 | 102.97 |
| December 2015 | 101.41 | 101.25 | 101.15 | 101.87 | 102.42 |
| January 2016 | 101.41 | 100.45 | 100.86 | 101.38 | 102.61 |
| February 2016 | 101.43 | 100.85 | 99.88 | 101.53 | 103.35 |
| March 2016 | 101.61 | 101.61 | 100.14 | 102.28 | 103.67 |
| April 2016 | 101.63 | 101.17 | 99.91 | 101.42 | 104.25 |
| May 2016 | 101.70 | 101.58 | 100.23 | 100.47 | 103.94 |
| June 2016 | 101.77 | 101.61 | 100.48 | 100.46 | 104.58 |
| July 2016 | 101.62 | 101.58 | 100.35 | 100.44 | 105.12 |
| August 2016 | 101.82 | 101.25 | 100.30 | 100.58 | 104.83 |
| September 2016 | 102.19 | 101.02 | 100.37 | 101.14 | 104.86 |
| October 2016 | 102.45 | 101.23 | 99.81 | 101.53 | 105.51 |
| November 2016 | 102.44 | 100.97 | 100.28 | 100.97 | 105.08 |
| December 2016 | 102.70 | 101.15 | 100.14 | 101.23 | 105.73 |
| January 2017 | 102.97 | 101.36 | 100.02 | 101.24 | 106.23 |
| February 2017 | 103.06 | 101.90 | 101.43 | 101.29 | 107.08 |
| March 2017 | 103.16 | 102.35 | 100.53 | 102.21 | 107.26 |
| April 2017 | 103.18 | 102.27 | 100.14 | 102.19 | 107.76 |
| May 2017 | 103.49 | 102.70 | 100.51 | 102.29 | 108.30 |
| June 2017 | 103.74 | 102.96 | 100.18 | 102.62 | 109.16 |
| July 2017 | 103.81 | 103.72 | 100.11 | 101.98 | 108.94 |
- Date modified: