
Publications
The Canadian Labour Market at a Glance
Workers within 10 years of retirement age

Archived Content
Information identified as archived is provided for reference, research or recordkeeping purposes. It is not subject to the Government of Canada Web Standards and has not been altered or updated since it was archived. Please "contact us" to request a format other than those available.
The proportion of workers approaching retirement continues to climb
-
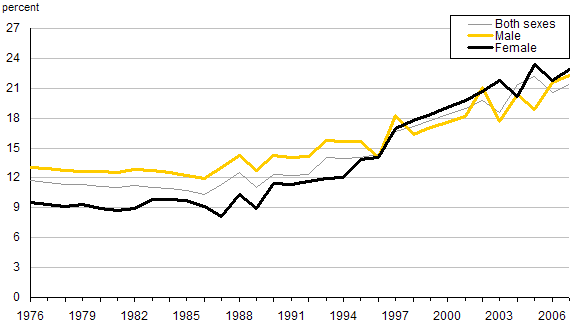
From 1976 to 1986, the proportion of workers nearing retirement—those who were within 10 years of the median retirement age or were older than the median retirement age—remained steady at about 11%. During that period, the median age at retirement hovered around 65. Subsequently, however, the retirement age fell from 64.6 in 1986 to 60.6 in 1997. Over the same period, the proportion of workers within 10 years of the median retirement age—the near-retirement rate—increased by 6.3 percentage points to 16.6% in 1997.
-
From 1997 to 2007, the proportion of workers nearing retirement was on an upward trend, increasing 4.8 percentage points to 21.4%. During that period, the oldest baby boomers entered the group of workers approaching retirement, which had a greater influence on the rise of the near-retirement rate than the median retirement age at that time (which hovered around 61). In 2007, there were 3.6 million workers nearing retirement.
-
Long-term trends for men and women are similar. However, the proportion of employed women within 10 years of their median retirement age has been increasing faster than that of men since 1989. The likely explanation is that the median retirement age declined much more for women than for men during that period. A greater proportion of women than men work in the public sector, where employees retire at a younger age than private sector employees or the self-employed. In 2007, the proportion of workers nearing retirement was 22.3% for men and 22.9% for women.
Chart M.4
Proportion of workers within 10 years of, or older than, the median retirement age, by sex, 1976 to 2007
Source: Statistics Canada, Labour Force Survey.
- Date modified: