75-001-XIE

 |
November 2000 Vol. 1, no. 2 |
Income inequality within provinces
Inequality of income distribution is a subject of continual debate. Canada is no less affected than other countries by this situation, whether at the national or provincial level. Public interest in this phenomenon is always high.
This article looks at the degree of inequality in the distribution of total income, market income and after-tax income within each province, and compares it with the degree of income inequality in the other provinces. The study does not consider which province has the highest or lowest average income, but which province has the most or the least inequality in its distribution of income. The article covers the years 1980 to 1998 (see Data sources and definitions).
The study does not attempt to determine the reasons for or sources of provincial inequalities, but rather to describe them and to see how they behave over time.
Studies that have addressed this issue so far seem to agree in most cases. All show differences in the degree of income inequality within the provinces. Some state that such differences between provinces have been shrinking since 1960. Others qualify their conclusions, arguing that it depends on how income is defined. Nevertheless, most seem to agree that inequalities in earnings have grown in the majority of provinces. Moreover, the trends observed are the same regardless of sex or age group (Finnie, 1998). Interprovincial variability indicators are higher for market income than for total income (Alter and Greenberg, 1990). The gaps are smaller, however, when the comparison is done with after-tax income. Thus, inequality tends to be reduced by taxes and government transfer payments, and increased by capital income.
In this analysis, inequalities in family income distribution are examined by province using a straightforward approach based on upper and lower quintile ratios. The family unit is treated as a whole, without regard for the presence or absence of children or for differences in the marital or labour market status of family members.
Gaps are widest for market income
In Canada, the inequality ratio was highest for market income and lowest for after-tax income for every year in the study period (Chart A). Inequalities are thus reduced by government transfer payments and income taxes. The gap in average market income between the upper and lower quintiles was at least twice as large as the average after-tax gap, regardless of the year. In 1998, for example, for every dollar of market income for the 20% of economic families with the lowest incomes, the 20% with the highest incomes had, on average, $14.50. When the comparison is based on after-tax income, the difference was only $5.40.
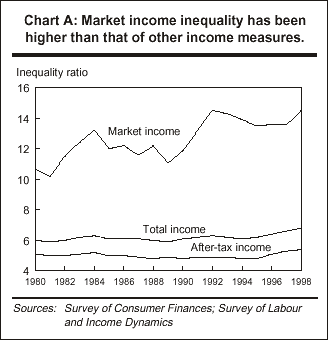
The inequality ratio for market income rose from 10.70 in 1980 to 14.50 in 1998. Most of the increase occurred during the recessions of the early 1980s and 1990s. The ratios for the other two income measures grew, but on a smaller scale: the total-income ratio edged up from 6.00 to 6.80 between 1980 and 1998, while the after-tax ratio shifted from 5.10 to 5.40. After remaining relatively stable in the early 1990s, they experienced a marked increase toward the latter half of the decade.
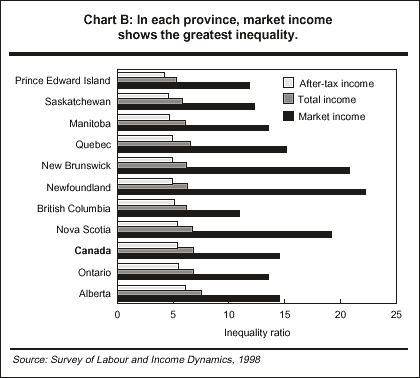
The findings for the various inequality ratios also apply provincially. Thus, for any year and any province, the inequality ratio was greatest for market income and smallest for after-tax income (Table), reflecting the effects of taxes and government transfers.
Inequality ratio varies by province
To compare income inequality by province, the study chose the provinces with the largest and smallest gaps in after-tax income. After-tax income was chosen because that was the measure used to form the income quintiles on which the inequality ratios were based. Moreover, after-tax income is closer to disposable family income.
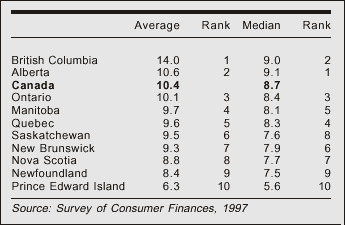
In 1998, Prince Edward Island had the smallest inequality ratio for after-tax income, while Alberta had the largest (Chart B). In Prince Edward Island, the 20% of families with the highest incomes had $4.20 in after-tax income for every dollar of the 20% with the lowest incomes. In Alberta, this gap was $6.10. The difference between these two provinces was smaller for after-tax income ($1.90) than for market income ($2.70), matching the intraprovincial trends. This comparison can be made for any pair of provinces.
Provincial differences in market income have widened
The study also looked at provincial differences in income inequality each year from 1980 to 1998, by studying the gap between the province having the greatest inequality and the one having the least.
Once again, market income demonstrated the largest difference in inequality ratios each year (Chart C). ![]() 1 Over the entire period studied, the difference was about seven times larger, on average, for this measure than for total income or after-tax income—and it increased over time (from 7.20 in 1980 to 11.30 in 1998). The largest gap was almost 21 in 1995. This was attributable to an exceptionally high ratio for market income in Newfoundland (30.40)
1 Over the entire period studied, the difference was about seven times larger, on average, for this measure than for total income or after-tax income—and it increased over time (from 7.20 in 1980 to 11.30 in 1998). The largest gap was almost 21 in 1995. This was attributable to an exceptionally high ratio for market income in Newfoundland (30.40) ![]() 2 in contrast to a low of 9.50 in Alberta.
2 in contrast to a low of 9.50 in Alberta.
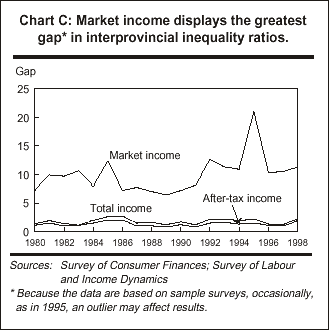
Despite relative stability at the beginning of the study period, up to the mid-1990s, differences grew between the province with the lowest ratio for total and after-tax income and that with the highest. The differences sharpened between 1997 and 1998. Over the full 1980-to-1998 period, the gap in total income grew from 1.40 to 2.20, while that for after-tax income edged up from 1.10 to 1.90.
How has inequality changed within provinces?
An examination of the change in gaps within each province from 1980 to 1998 confirms the observations about differences between the provinces. That is, inequalities in market income tended to increase (Table). The two other income measures reveal a similar tendency—though on a smaller scale—for the majority of provinces.
As for market income ratios, Alberta, Newfoundland, Nova Scotia and Prince Edward Island saw very marked increases from 1996 to 1998. Their ratios grew by 4.10, 3.00, 2.40 and 2.20, respectively. Over the same period, moderate increases took place in New Brunswick (0.90), British Columbia (0.70), Ontario (0.60) and Manitoba (0.60). Quebec and Saskatchewan registered drops in their inequality ratios.
Between 1996 and 1998, only Saskatchewan saw a slight decline (0.40) in its ratio for total income, while Manitoba's remained stable. This ratio edged up by 1.10 in Alberta and by less than 0.60 in the rest of the provinces. In the case of after-tax income, the ratio in Saskatchewan dipped by 0.30, and those of British Columbia and Manitoba, by 0.20 and 0.10. Alberta registered an increase of 1.10, while Ontario, Nova Scotia, Quebec and Newfoundland saw rises of less than 0.60. Ratios in New Brunswick and Prince Edward Island remained stable.
Summary
Inequalities in income distribution within provinces follow a pattern consistent with the findings of a number of studies. In particular, market income exhibits greater inequality than the other two measures, total income and after-tax income. The same observation applies at the national level.
Throughout the period studied, Prince Edward Island exhibited the lowest inequality ratio for both total income and after-tax income. Newfoundland had, for most of the period, the highest inequality ratio with respect to market income.
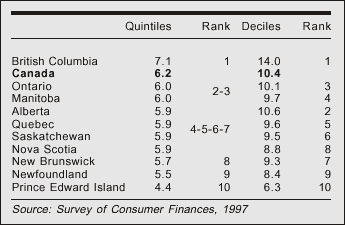
The results of this analysis apply to economic families, without regard for family composition. One possible avenue of future research would be to study the differences in inequality ratios relative to family composition. As well, these ratios could be based on income deciles rather than quintiles (see Ratios based on total income quintiles and deciles), which would provide some idea of the difference between incomes of the 10% of families with the highest incomes and those of the 10% of families with the lowest. Another option would be to use median income instead of average income, based on either quintiles or deciles (see Ratios of averages and medians based on total income deciles).
Data sources and definitionsThe data, from the Survey of Consumer Finances (SCF) and the Survey of Labour and Income Dynamics (SLID), cover 1980 to 1998. The SCF was an annual supplement to the Labour Force Survey until 1997. The recent publication of 1998 income data in the annual report Income in Canada (Statistics Canada, 1998) introduced SLID as the official source of annual data on income, replacing the SCF. This article uses SLID estimates for 1996, 1997 and 1998, as well as those of the SCF for 1980 to 1995. The latter have been revised to make them comparable. Economic family: two or more persons who live in the same dwelling and are related to each other by blood, marriage, common law or adoption. Market income: total earnings (from paid employment or self-employment), investment income, retirement income (private pension plan) and "other income." It excludes government transfers. It is also known as income before taxes and transfers. Government transfers: all direct payments to individuals and families by the federal, provincial and municipal governments: Old Age Security pensions, the Guaranteed Income Supplement, Spouse's Allowance, Canada and Quebec Pension Plan benefits, Child Tax Benefits, Employment Insurance benefits, workers' compensation benefits, credits for the goods and services tax (GST) or the harmonized sales tax (HST), provincial or territorial tax credits, social assistance payments and other payments. Total income: income from all sources before deduction of federal and provincial taxes. Total income is also known as income before taxes (but after transfers). It includes market income and government transfer payments. Income tax: total federal and provincial taxes on income and capital gains in a given year. After-tax income: total income minus income taxes. Quintile ratios: Most studies of provincial differences have used either the coefficient of variation or the Gini coefficient as a measure of inequality. This study uses the ratio of the average income of the top quintile to that of the bottom quintile. (The income averages are adjusted with sample weights.) This same measure is used in analyses accompanying published estimates of income distribution derived from the SCF. For all measures of income, quintiles are formed by ranking the families in ascending order of after-tax income and dividing the entire sample into five equal parts. The top quintile consists of the 20% of families with the highest after-tax incomes, and the bottom quintile, the 20% of families with the lowest incomes. Thus, the average market income of the top quintile is the average market income of families in the top after-tax income quintile. This method keeps the composition of each quintile constant. The inequality ratio measures how much the families in the top income quintile have, on average, for every dollar of those in the bottom quintile. The higher the ratio the greater the gap in income distribution among the families. For example, a ratio of 5 means that, on average, for every dollar claimed by the 20% of families with the lowest incomes, the 20% with the highest incomes had $5. |
Ratios based on total income quintiles and decilesThe ratio of the average income of the top decile to that of the bottom decile measures how much the 10% of families with the highest incomes have, on average, for every dollar of the 10% of families with the lowest incomes. Ratios based on deciles are higher than those based on quintiles.
|
Ratios of averages and medians based on total income decilesThe ratios are based on the amount that families in the appropriate quintiles or deciles have, on average. Median income could be used instead. Ratios based on averages are higher than those based on medians.
|
Notes
- The pattern for all provinces combined was similar.
- Because the data are based on sample surveys, occasionally, as in 1995, an outlier may affect results.
References
- Alter, H.E. and T.L. Greenberg. "Taxes, transfers and regional disparities." Perspectives on Labour and Income (Statistics Canada, Catalogue no. 75-001-XPE) 2, no. 4 (Winter 1990): 51-61.
- Finnie, R. "Differences in earnings inequality by province, 1982-94." Canadian Economic Observer (Statistics Canada, Catalogue no. 11-010-XPB) 11, no. 2 (February 1998): 3.1-3.12.
- Statistics Canada. Income in Canada. Catalogue no. 75-202-XPE. Ottawa, 1998.
Author
Dimitri Sanga is with the Prices Division. He can be reached at (613) 951-3116 or dimitri.sanga@statcan.gc.ca.
|
|
|
|
|
[ Highlights ] [ Main menu | Editor's corner | More news | Contact us | Survey information | Back issues ] [ Statistics Canada home page | In depth | Français ] |
|
© Statistics Canada - Conditions of use |