75-001-XIE

 |
May 2002 Vol. 3, no. 5 |
Seniors at work
Many Canadians perceive work as a tedious but necessary activity. It not only provides them and their dependants with the necessities of life, but also allows them to attain a higher standard of living than they would otherwise enjoy. Some people fantasize about winning a lottery to fund early retirement, while others count the days until they can substitute a pension for their paycheque and lead the kind of life they have dreamt of for years. This desire on the part of many workers is reflected by the ongoing decline in the median retirement age of workers in recent decades—from 64.9 years between 1976 and 1980, to 62.2 years between 1991 and 1995, to 61.0 years between 1996 and 2000 (see Fact sheet on retirement in this issue).
Despite this trend, a significant number of workers are not interested in early retirement. Indeed, many people greatly enjoy working throughout their lives, preferring to work until they are forced into retirement by ill health or age-related employment policies—or even until their dying day. While working seniors accounted for only 7.8% of their age group in 1996, some evidence suggests this proportion may increase in the future (Walsh, 1999).
This article focuses on the occupations of seniors who continue to work beyond 65—the traditional age of retirement. A number of demographic and other job characteristics are also examined, including age, sex, education, self-employment versus paid work, full-time versus part-time employment, and province or territory of residence (see Data source and definitions).
How many seniors are still at work?
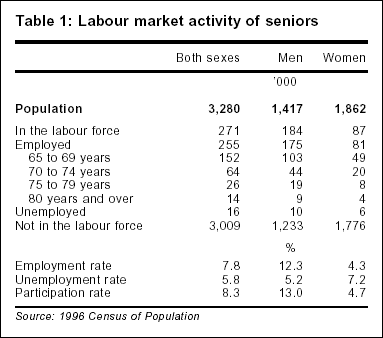
According to the 1996 Census, over one-quarter million (255,200) Canadians 65 and over were employed, accounting for 1 in 13 persons in this age group (Table 1). An additional 15,700 seniors reported being unemployed, for a total labour force of 271,000. ![]() 1
1
Although women accounted for the majority (57%) of the population aged 65 and over, most of the employed in this age group were men (68%). In contrast, the male-female employment split was more balanced in younger age groups. For example, men accounted for only 53% of all employed persons aged 25 to 54 in 1996. The relatively high proportion of men among employed seniors is likely due to the much lower labour force participation of senior women in their earlier years when social expectations were different than they are for younger women today. ![]() 2 As the baby boom generation ages, it is likely that the participation rate of older women will move closer to that of their male counterparts.
2 As the baby boom generation ages, it is likely that the participation rate of older women will move closer to that of their male counterparts.
The age distribution of working seniors is strongly skewed towards 'young seniors' (Chart A). In 1996, 65 to 69 year-olds accounted for 59% of employed seniors, and 70 to 74 year-olds made up an additional 25%. Nevertheless, close to 40,000 individuals (16%) aged 75 and over reported being employed.
The following sections examine the characteristics of working seniors, and offer some reasons why they may have chosen to continue working.
Better-educated seniors are more likely to be working
Highly educated Canadians are much more likely than those with less schooling to continue working beyond the expected age of retirement (Chart B). In 1996, 1 in 5 seniors with a university degree was employed. In sharp contrast, less than 1 in 20 seniors with an elementary school education (grade 8 or less) had a job. The rates for those with intermediate levels of education lay somewhere between these two extremes.
Seniors, in general, possess less education than persons in younger age groups. For example, 37% of seniors had, at most, an elementary school education, compared with only 8% of the population aged 15 to 64 (Table 2). Nevertheless, working seniors were, on average, better educated than others in their age group. Almost one-quarter (23%) of employed persons 65 and over had at least some university education, compared with only 10% of seniors who were not employed. At the other end of the spectrum, 44% of working seniors reported having had, at most, an elementary or partial secondary school education, compared with 63% of those who were either unemployed or not in the labour force.
Jobs requiring higher levels of education are often more intellectually challenging and less physically demanding than those with lower educational requirements—factors which may contribute to the observed differences. Furthermore, because work requiring higher or specialized education is generally associated with better remuneration, the opportunity cost of retirement may be greater, on average, for people performing these jobs than for seniors with less schooling. Also, people with advanced levels of education (such as medical doctors, other occupations requiring professional degrees, and PhD degree holders) generally begin their careers later—in their late 20s or early 30s. Some of them may choose to work longer to accumulate the savings required to ensure a desired lifestyle after they stop working. Indeed, such occupations exhibit a different career age structure than the types of jobs generally held by people who possess only a high-school or college diploma (Kaufman and Spilerman, 1982). ![]() 3
3
Self-employed seniors
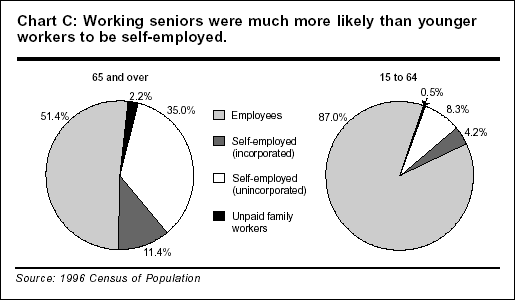
Working seniors were almost four times more likely to be self-employed than their younger counterparts. In 1996, 46% of employed persons 65 and over were self-employed, compared with only 13% of workers aged 15 to 64 (Table 3). ![]() 4 Most of these seniors (57%) were working owners of unincorporated businesses without paid help. Working seniors were also somewhat more likely than younger people to report unpaid family work (2.2% versus 0.5%, respectively).
4 Most of these seniors (57%) were working owners of unincorporated businesses without paid help. Working seniors were also somewhat more likely than younger people to report unpaid family work (2.2% versus 0.5%, respectively).
Self-employment and, to a lesser extent, unpaid family work, may be popular among older workers because it allows more independence and flexibility of work scheduling. In some cases, a person may have been self-employed for many years, and is simply continuing to work beyond age 65 at the same or reduced pace ![]() 5 for financial
5 for financial ![]() 6 or other reasons.
6 or other reasons.
Although seniors were more likely than younger workers to be self-employed, the majority of seniors (51%) were employees. In comparison, almost 9 in 10 employed 15 to 64 year-olds were employees (Chart C).
Class of worker and occupation are strongly related. For example, common occupations among the self-employed include farming, managing a retail business, and sales or service jobs (Marshall, 1999). Many professionals such as doctors, lawyers and architects are also self-employed. On the other hand, most people in teaching and nursing occupations are employees with employer-sponsored pension plans that permit retirement before 65. ![]() 7 In some occupations held by employees (for example, pilots and firefighters), early retirement is required or strongly recommended (see Job tenure).
7 In some occupations held by employees (for example, pilots and firefighters), early retirement is required or strongly recommended (see Job tenure).
Seniors rarely seen in certain occupations
The age distribution of workers in specific occupations is a function of many factors, some working in tandem and others in conflict. The physical demands of some jobs determine a person's ability to perform the required tasks. Since physical characteristics (such as eyesight, reflexes, strength, and manual dexterity) deteriorate with age, occupations with physical requirements tend to be filled by younger workers. Such occupations include professional athletes (none reported over the age of 65), air traffic controllers (fewer than 20 of 4,205 were 65 and over), ambulance attendants and other paramedics (30 of 13,245), underground miners (70 of 14,205), sawmill machine operators (80 of 14,620), material handlers (380 of 117,235), and cashiers (1,105 of 250,120).
Some jobs require a high educational attainment, specialized skills, or knowledge of computer or other technologies. Since working seniors as a group tend to have less schooling than their younger counterparts, they may be less likely to fill such jobs. For example, in 1996 only 25 of 16,240 computer engineers were aged 65 and over, as were 40 of 9,105 biological technologists and technicians.
Also, the retirement rules of many employer-sponsored pension plans are structured so that workers in some occupational groups are encouraged to retire at 65 or even earlier through the provision of generous retirement benefits. These groups include police officers (only 70 of 55,005 were 65 and over in 1996), military personnel (125 of 49,145 non-commissioned soldiers in infantry, airborne and maritime units classified to other ranks, Armed Forces), and teachers (690 of 226,105 elementary school teachers and counsellors).
Finally, labour market supply and demand shifts for economic or other reasons, can shape the age structure of an occupational group, since the need for workers does not remain constant over time. Long-term provincial and federal government cutbacks have skewed the age distribution of workers in nursing, teaching and other occupations. The ongoing discovery and implementation of new technologies has created new occupations, while obsolete ones have disappeared. In recent decades, globalization, combined with the shift from a goods-producing to a services-producing economy, has also left its stamp on the Canadian labour market, and in turn has affected the supply and demand for senior workers.
Common fields of work for seniors
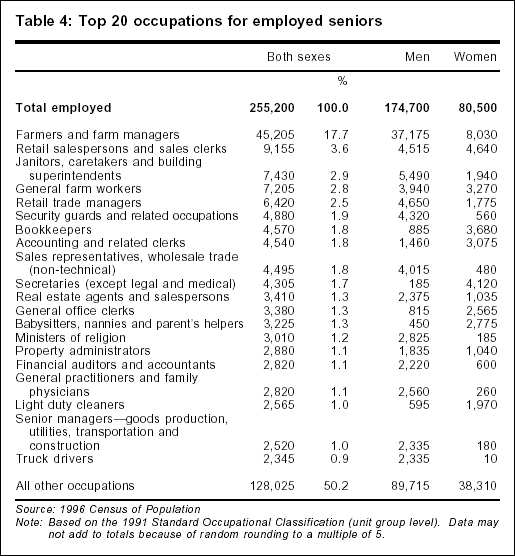
Twenty occupations account for half of total employment among workers aged 65 and over (Table 4). ![]() 8 Farmers and farm managers alone made up 17.7% of this total, with 45,205 employed seniors in 1996. Although a large majority (8 in 10) of these workers were men, farming and farm management was also the number one occupation reported by senior women. In addition, seniors were relatively common among general farm workers (2.8%—ranking fourth for both sexes combined). Almost as many women as men performed general farm work.
8 Farmers and farm managers alone made up 17.7% of this total, with 45,205 employed seniors in 1996. Although a large majority (8 in 10) of these workers were men, farming and farm management was also the number one occupation reported by senior women. In addition, seniors were relatively common among general farm workers (2.8%—ranking fourth for both sexes combined). Almost as many women as men performed general farm work.
Given that most farmers are self-employed (8 in 10) and that self-employment is common among seniors, it is to be expected that many farmers and farm workers would be 65 and over. Moreover, "Because farmers usually live where they work, they tend to stay active on their farms longer than others in the labour force, even if they choose to scale back the extent of their operations and enter semi-retirement. In addition, some farmers remain involved in farming with their adult children, while others may enter agriculture as a hobby after retiring from the general labour force" (Statistics Canada, 1999). ![]() 9
9
Nevertheless, since World War II, the Canadian farm population and the number of farms have both fallen dramatically, while average farm size has increased. In 1941, the farm population exceeded one-quarter of the total population; by the mid-1990s, it had shrunk to a mere 3% (Statistics Canada, 1997). This long-term trend would suggest fewer older farmers in the near future. However, a strong countervailing trend—Canada's aging population—is also evident in the farming population. Seniors accounted for 8.3% of people living on farms in 1996, compared with 5.9% in 1971. And in 1996, about one in three farm operators was at least 55.
Farmers aged 65 and over were more likely to be self-employed if they were men (89% compared with 68% of women); 9 in 10 of these farmers were unincorporated. Although 20% of women reported themselves as employees, this may be a function of tax law, which allows owners of unincorporated businesses to claim a spousal employee's wages as a tax deduction. ![]() 10
10
Many seniors worked in a sales occupation of some sort, such as retail sales (the second most popular type of job, accounting for 3.6% of total employment in this age group), non-technical wholesaling (1.8%), or real estate (1.3%). Retail trade management was also popular (2.5%). Just over half of retail salespersons were women (51%), while men were the norm among wholesalers (89%), real estate agents (70%) and retail trade managers (72%). Most of the workers in these jobs were employees—with the exception of retail trade managers, who were more likely to be self-employed.
The third most common occupation group for seniors was janitors, caretakers and building superintendents (2.9%)—three in four were men and most were in paid jobs. Related occupations included property administration (1.1%) and light duty cleaning (1.0%). About 6 in 10 property administrators were men, and over half were self-employed. In contrast, 77% of light duty cleaners were women, and most were employees.
Seniors working at office jobs, particularly as bookkeepers, accounting and related clerks, secretaries (except legal and medical), and general office clerks, accounted for 6.6% of employed seniors. Four in five of these jobs were performed by women and most were paid.
Seniors in professional occupations were most likely to be religious ministers (1.2%), financial auditors and accountants (1.1%), or general practitioners and family physicians (1.1%). Most of these jobs require a high or specialized education and tended to be occupied by men (94% of ministers, 79% of auditors and accountants, and 91% of family physicians). While the vast majority of ministers were employees (91%), two in three financial workers and three in four physicians were self-employed—most of them unincorporated.
The remainder of the top 20 occupations were rather disparate: security guards (ranking sixth in popularity); babysitters, nannies and parent's helpers; senior managers in goods production, utilities, transportation and construction; and truck drivers. Women did most of the babysitting (86%), while men dominated the other occupations (89% of guards, 93% of managers, and virtually all truckers). Almost half of the managerial jobs involved self-employment; most others were paid.
Jobs with a high concentration of seniors
While the occupations most favoured by seniors have been noted above, older workers actually account for a very low proportion of total employment in the majority of these jobs.
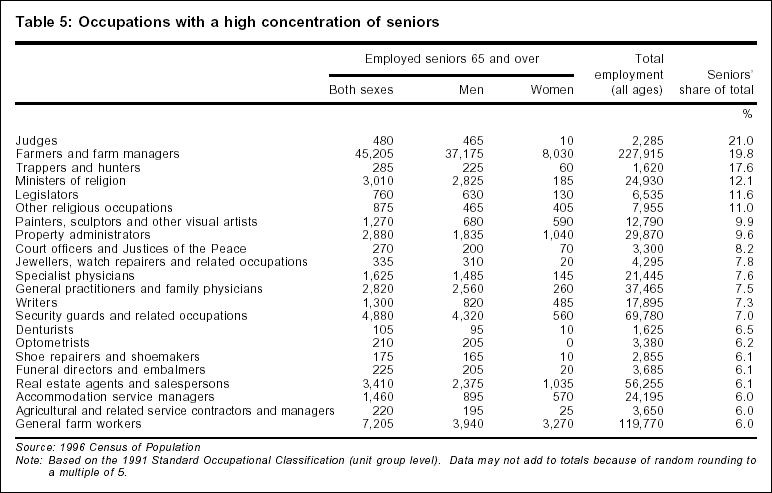
In 22 occupations, however, at least 6% of the workforce was made up of men or women aged 65 and over (Table 5). ![]() 11 In 6 of these, more than 1 in 10 workers were seniors. Judges topped the list—1 in 5 was at least 65 years old (480 of 2,285). Since judgeships are usually conferred upon people with a great deal of experience in the legal profession, judges would naturally be older on average than workers pursuing other careers.
11 In 6 of these, more than 1 in 10 workers were seniors. Judges topped the list—1 in 5 was at least 65 years old (480 of 2,285). Since judgeships are usually conferred upon people with a great deal of experience in the legal profession, judges would naturally be older on average than workers pursuing other careers.
Two other occupational groups in the legal domain also had high concentrations of seniors: legislators (11.6% of these individuals were at least 65), and court officers and Justices of the Peace (8.2%). The official retirement age of senators is 75, and many federal, provincial and municipal legislators work well beyond age 65.
Next to judges, the occupations most likely to accommodate older workers were farming and farm management (19.8% were 65 and over), and trapping and hunting (17.6%). Since few people today earn a living through trapping and hunting (only 1,620 in 1996), it is not surprising that so many of them were seniors.
Ministers of religion and workers in other religious occupations complete the top six grouping of jobs with a large presence of seniors (12.1% and 11.0% of their respective workforces). Although some have been ministers for many years, others turn to this vocation after leaving a former career. It is quite common for religious ministers to work into their seventies as they continue to conduct religious services and pursue scholarly interests.
Two occupational groups stand out as possible artefacts of data collection practices: painters, sculptors, and other visual artists; and writers. In 1996, the census identified 1,270 seniors as employed artists, accounting for 9.9% of all people in this occupational group; similarly, 1,300 seniors were employed as writers (7.3% of the total). However, many artists or writers must take on a second job to make ends meet. If the usual weekly hours worked at the second job exceed those spent as an artist or writer, the second job will be recorded as the main job. This means that the number of people under age 65 classified as artists and writers in census tabulations may be underestimated; in this case, the concentration of seniors would be overestimated.
An added complication is that the distinction between a professional artist or writer and an amateur can be difficult to make. Many individuals pursue an artistic interest for years as a hobby. A hobby that does not provide income is not considered employment. In some cases, a person retires from a lifelong career and converts what was once a hobby into a second career, which then earns income and is therefore considered employment. Artists and writers who are able to earn a living at their career during pre-retirement years are apt to continue doing so long after age 65, unless health problems intervene.
Several medical occupational groups also feature relatively high concentrations of seniors: physicians (both specialists and general practitioners), denturists, and optometrists. Other notable occupations popular among seniors include jewellers and watch repairers, shoemakers and repairers, and funeral directors and embalmers.
Male versus female jobs
The division of labour among today's seniors remains traditional. Specific occupations tend to be dominated by men (for example, judges and religious ministers) or by women (secretaries and babysitters). These patterns likely reflect the social environment of these seniors when they were school-aged and, later, when they entered the job market—years before affirmative action programs and anti-discrimination legislation. As younger Canadians age and enter their senior years, these jobs will likely become less polarized.
Most employed seniors work full time
The majority (58%) of the 242,200 seniors who were employed during the census reference week and who also had worked in 1995 reported working mainly full time that year. ![]() 12 Nevertheless, this percentage was significantly less than that of workers aged 15 to 64 (79%).
12 Nevertheless, this percentage was significantly less than that of workers aged 15 to 64 (79%). ![]() 13 Almost two in three men 65 and over worked mainly full time (63%), compared with only 47% of women. The comparable figures for persons 15 to 64 were 88% and 69% (Table 6).
13 Almost two in three men 65 and over worked mainly full time (63%), compared with only 47% of women. The comparable figures for persons 15 to 64 were 88% and 69% (Table 6). ![]() 14
14
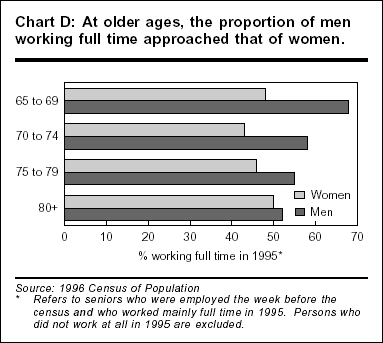
The proportion of employed men 65 and over who worked full time dropped with age (Chart D). The biggest drop in 1995 occurred between the 65-to-69 and 70-to-74 age groups (from 68% to 58%). But even among those aged 80 and over, more than half worked mainly full time (52%). The proportion of older women working full time by age group was more stable, fluctuating around that for all senior women (47%).
Seniors who were working mainly full time in 1995 were somewhat more likely to be self-employed than those working part time (49% versus 43%). The proportion who were self-employed tended to rise with age, peaking at 64% among those aged 75 to 79 and working mainly full time, and 56% among those aged 80 and over and working mainly part time.
Over half of working men 65 and over were self-employed, working either mainly full time (54%) or part time (52%). Women were much less likely to be self-employed, particularly those who worked mainly part time—only 29%, compared with 36% who worked mainly full time.
Since the incidence of part-time work among employed seniors was double that of younger workers (42% versus 21%), it would appear that shorter workweeks may in some cases ease the transition into retirement. For example, a person may continue to work for the same employer, but at a reduced pace, for a few years immediately preceding retirement. Another person may retire from a full-time job with a long-time employer to work part time in a similar occupation (for example, a long-distance trucker may switch to local bus driving), or in a job that is less physically demanding. The purpose of the part-time job may be to supplement pension income or to occupy some of the day. Some retirees also have more time for a hobby that now generates income.
On the demand side, many employers need the flexibility offered by part-time workers to meet labour demands that may fluctuate daily, weekly, or seasonally (such as Christmas)—for example, restaurant workers, bus drivers, and retail salespersons.
Older workers are more common on the Prairies
While 1.9% of the national workforce was 65 and over, the representation of seniors in the workforce varied considerably by province, reflecting their different economies (Chart E). Given the high proportion of working seniors in farming occupations, working seniors were more common in provinces where these jobs account for a relatively large segment of the workforce ![]() 15 and the agricultural sector is a significant component of the economy.
15 and the agricultural sector is a significant component of the economy. ![]() 16
16
Indeed, the highest concentration of seniors in the workforce was found in Saskatchewan (4.6% of total employment), followed by Manitoba (2.5%), Alberta (2.2%), and Prince Edward Island (2.1%). At the other end of the scale, relatively few seniors were working in Newfoundland and Labrador (only 0.7%), a reflection perhaps of its persistently high rates of unemployment. ![]() 17
17
Similarly, the employment ratio of seniors was by far the highest in the Prairie provinces, particularly Saskatchewan where 15.8% of seniors (almost one in six) had jobs; Alberta was close behind, at 12.3%. In contrast, only 2.4% of seniors living in Newfoundland and Labrador had jobs. ![]() 18
18
The proportion of self-employed seniors was particularly low in Quebec—only 35% (Chart F). It was highest in Saskatchewan, where 7 in 10 seniors were self-employed, and notably high in Alberta and Manitoba (over 55%). The proportion of the senior workforce accounted for by unpaid family workers was also high in these three provinces: 4.6% in Saskatchewan, 3.3% in Alberta and 3.0% in Manitoba (most of this unpaid labour would have been farm-related).
Summary
This article provides an overview of the demographic and job characteristics of people who continue working beyond age 65—the traditional age of retirement. Characteristics that could lead younger Canadians to become working seniors include advanced education, self-employment, and an occupation (such as farming, accounting or sales) that lends itself to working past 65, either full time or part time.
In recent years, more men and women have continued to work beyond age 65. This reflects the growing popularity of alternative work arrangements such as self-employment and part-time work, the rising educational attainment of Canadians generally, the increased labour market participation of women, and the proliferation of new jobs based on innovative technologies requiring intellectual as opposed to physical capabilities. ![]() 19
19
In the coming decades, Canada's large, well-educated and aging baby-boom cohort will add fuel to this trend (the oldest boomers will reach age 65 in 2010). Consequently, it seems very likely not only that working seniors will account for a substantial proportion of the workforce in the near future, but also that they may become the rule rather than the exception.
Data sources and definitionsThe Census of Population is conducted every five years to gather demographic, social, economic and cultural information on Canadians. Most households (80%) receive the short form, which asks for basic information only. The remaining 20% receive the long form, which asks these same questions plus more detailed ones, including labour market activities during the week prior to enumeration as well as during the previous year. The 20% sample information is later weighted to represent all Canadians. This article uses the 1996 Census of Population, carried out on May 14 of that year. Institutional residents living in collective dwellings such as nursing homes and penal institutions are excluded from the labour force. Unpaid household activities and volunteer work are excluded from the definition of work. Persons in the labour force were either employed or unemployed during the week preceding the census. The employed are persons aged 15 and over who, during the week preceding the census, worked for pay (earned wages, a salary, tips, or commissions; were paid in kind; or served in a religious order or the Armed Forces); or worked for profit in their own business, farm or professional practice; or worked without pay in a family farm or business (unpaid family workers). Also included are persons who were temporarily absent from their job or business for the entire week because of vacation, illness, a labour dispute at work, maternity leave, bad weather, fire, family responsibilities, or some other reason. The unemployed are persons aged 15 years and over, excluding institutional residents, who were without paid work and were available for work during the week preceding the census and who actively looked for work in the preceding four weeks, or were on temporary layoff and expected to return to their job, or had a definite arrangement to start a new job within four weeks. The employment rate is the number of employed persons expressed as a percentage of the relevant population. The participation rate is the percentage of the population in the labour force. The unemployment rate is the number of unemployed persons as a percentage of the number of people in the labour force. Class of worker indicates whether a person is an employee (that is, working for a wage or salary, a commission, or payment in kind); self-employed on a farm, in a business, or in a professional practice (either incorporated or unincorporated, with or without paid help); or an unpaid family worker (that is, a person 15 years of age and over who works without pay on a farm or in a business owned or operated by a family member living in the same household). Full-time workers are those who reported working 30 hours or more per week during most of the weeks that they were employed. Part-time workers worked less than 30 hours per week. (In the case of people who had more than one job during the same week, the hours spent at all jobs were combined.) Persons in full-time employment for part of 1995 and in part-time employment for another part were asked to report information for the job at which they worked the most weeks. |
Job tenureThe tenure of the last job held prior to retirement is one of the most important variables influencing the timing of retirement (Gower, 1997). Employees with a short job tenure tend to retire later than those who have worked more years at the same job. For example, from 1991 to 1995, employees in the public sector (including health, education and public administration) with a job tenure of less than 20 years retired at a median age of 62.1, compared with 58.6 for those with a tenure of 20 years or more. The median retirement age among employees in the private sector exhibited the same pattern: 64.6 (tenure less than 20 years) versus 61.3 (tenure of at least 20 years). These observed patterns may arise, in part, because people working for an employer that provides a pension plan will usually be entitled to better benefits the longer they keep working for that employer. Also, companies providing pension plans may be more stable (that is, more likely to stay solvent and avoid employee layoffs) and have a larger complement of employees—which in turn translates into longer tenure. The presence of employer-sponsored pension plans has also been linked with higher retirement incomes (Gower, 1995). As for the self-employed, the situation was quite different. The median retirement age was younger among self-employed workers whose job tenure immediately prior to retirement was less than 20 years (64.6) than it was among those with a tenure of at least two decades (65.8). This pattern reversal suggests that the retirement decisions of self-employed workers may be based on different criteria. For example, some self-employed workers may postpone retirement because they derive enjoyment from being their own boss; others may need to keep working because of insufficient retirement pension income. Also, self-employment is more common in some industries and occupations than in others, and their associated job characteristics may affect the timing of retirement. Unfortunately, the effects of job tenure on the working patterns of seniors could not be examined in this study because job tenure was not asked in the 1996 Census. |
Notes
- The 1996 Census of Population was carried out on May 14th of that year. Respondents were asked if they had worked during the week prior to enumeration.
- For example, at the time of the 1996 Census, 77% of women (and 91% of men) aged 25 to 54 were in the labour force. In contrast, monthly data obtained from the Labour Force Survey for May 1966 (these data were not collected in the 1966 Census) show only 36% of 25 to 54 year-old women (but 97% of men) in the labour force. (This cohort would have aged to between 55 and 84 in 1996.)
- Highly educated workers are also more likely to retire early than those with less schooling. This apparent contradiction may arise in part because many early retirees were formerly employed in the public sector—particularly in public administration, educational services, communication and utilities industries, and health care and social services. These industries are associated with employer-sponsored pension plans that enable employees to retire before they become eligible for Canada or Quebec Pension Plan benefits (Kieran, 2001).
- The self-employed with incorporated businesses are often treated as employees, since they are deemed to work for the corporate entity. In this article, however, they are considered to be self-employed—a more meaningful description of their working conditions.
- The volume of work performed by seniors can be approximated using the full-time/part-time variable, which is examined in the section Most employed seniors work full time.
- Some self-employed seniors may be obliged to keep working to ensure an adequate standard of living. For example, self-employed workers do not benefit from employer-sponsored pension plans, unless they are working owners of incorporated businesses that offer such plans.
- A similar relationship exists between retirement age, class of worker, and industry. For example, using the Labour Force Survey, Kieran (2001) showed that workers in the agricultural sector, who are primarily self-employed, were the least likely to retire early. In contrast, industries with the highest early retirement rates also had the highest proportion of public-sector workers—who are employees.
- These statistics were compiled by unit group—the most detailed level of disaggregation in the 1991 Standard Occupational Classification, which contains a total of 514 unit groupings (Statistics Canada, 1993).
- As well, more than half (53%) of seniors engaged in unpaid family work in 1996 were doing farm work. And almost three in four (72%) unpaid family farm workers were women (Statistics Canada, 1999).
- This law was introduced in 1980. Prior to that time, the deduction was available only to owners of incorporated businesses (Duchesne, 1989).
- The occupations common to both Tables 4 and 5 are farmers and farm managers, ministers of religion, property administrators, general practitioners and family physicians, security guards, real estate agents, and general farm workers.
- A small proportion (5%) of the 255,200 seniors who had a job the week before the 1996 Census were not employed at all in 1995. This was also the case for 3% of the 13.1 million 15 to 64 year-olds. Many reasons in addition to job loss followed by long-term unemployment could account for this type of labour market behaviour—for example, a lengthy vacation or illness. (These absences would have been unpaid. People who were on paid vacation or sick leave or involved in a labour dispute are considered employed.) Among younger workers, school attendance or unpaid maternity leave could also be reasons for not having worked in 1995.
- Kieran (2001) also shows that early retirement rates are higher among full-time than among part-time workers. Forty-six percent of recent retirees who worked full time prior to retirement left work before age 60, compared with 30% of those who worked part time. These differences may arise because full-time workers tend to earn more (and consequently may be able to save more for retirement) and are more likely to enjoy employer-sponsored retirement benefits.
- Full-time senior workers were more likely to be male than were full-time workers aged 15 to 64 (75% versus 60% in 1995). Although men also accounted for the majority of seniors who were working mainly part time that year (60%), younger workers employed less than 30 hours per week were much more likely to be female (68% of part-time workers aged 15 to 64).
- According to the 1996 Census, the number of Canadians employed in agricultural and related services industries accounted for 3.1% of total employment nationally. This proportion differed substantially across the provinces. It was highest in Saskatchewan (16.3% of all persons employed and lowest in Newfoundland and Labrador (a mere 0.8%).
- In 1996, agriculture and related services industries accounted for 1.9% of Canada's gross domestic product. This proportion varied widely across the provinces. It was highest in Saskatchewan (11.6%), followed by Manitoba (5.4%), Prince Edward Island (5.1%) and Alberta (3.2%). In contrast, agriculture accounted for only 0.4% in Newfoundland and Labrador, and 0.9% in British Columbia.
- For example, according to the Labour Force Survey, the unemployment rate in Newfoundland and Labrador for persons aged 15 and over averaged 19.3% in 1996. In stark contrast, that same year unemployment rates averaged 6.6% in Saskatchewan, 6.9% in Alberta and 7.2% in Manitoba.
- The employment rates for the other provinces were: Prince Edward Island, 8.1%; Nova Scotia, 4.8%; New Brunswick, 4.3%; Quebec, 5.2%; Ontario, 8.3%; Manitoba, 9.1%; and British Columbia, 7.5%. High rates were also found in the territories, but these were based on sparse and unreliable data.
- Between 1986 and 1996, the number of employed men 65 and over rose 16%, from 150,700 to 174,700. The number of women increased even more dramatically—up 30%, from 61,800 to 80,500.
Gower (1997) also showed class of worker to be an important factor in the timing of retirement. The self-employed tended to retire later than employees; and the self-employed with unincorporated businesses and no employees retired last (based on Labour Force Survey data).
References
- Duchesne, D. The Decline of Unpaid Family Work in Canada. Labour Analytic Report. Statistics Canada, Catalogue no. 71-535 no. 2. Ottawa, 1989.
- Gower, D. "Measuring the age of retirement." Perspectives on Labour and Income (Statistics Canada, Catalogue no. 75-001-XPE) 9, no. 2 (Summer 1997): 11-17.
- ---. "Men retiring early: How are they doing?" Perspectives on Labour and Income (Statistics Canada, Catalogue no. 75-001-XPE) 7, no. 4 (Winter 1995): 30-34.
- Kaufman, R. and S. Spilerman. "The age structure of occupations and jobs." American Journal of Sociology 87, no. 4 (January 1982): 827-851.
- Kieran, P. "Early retirement trends." Perspectives on Labour and Income (Statistics Canada, Catalogue no. 75-001-XPE) 13, no. 4 (Winter 2001): 7-13.
- Marshall, K. "Working together: self-employed couples." Perspectives on Labour and Income (Statistics Canada, Catalogue no. 75-001-XPE) 11, no. 4 (Winter 1999): 9-13.
- Statistics Canada. "Agriculture-population linkage database—1996 Census of Agriculture." The Daily, April 26, 1999.
- ---. "Fact sheet on retirement." Perspectives on Labour and Income (Catalogue no. 75-001-XPE) 14, no. 2 (Summer 2002): 45-51.
- ---. Historical Overview of Canadian Agriculture. Catalogue no. 93-358-XPB. Ottawa, 1997.
- ---. Standard Occupational Classification, 1991. Catalogue no. 12-565E. Ottawa, 1993.
- Walsh, M. "Working past age 65." Perspectives on Labour and Income (Statistics Canada, Catalogue no. 75-001-XPE) 11, no. 2 (Summer 1999): 16-20.
| This article would not have been possible without the availability of specialized tabulations. The author would like to thank Sandra Swain and Catherine Corriveau of the Labour Statistics Division for their generous help in providing data. |
Author
Doreen Duchesne is with the Labour and Household Surveys Analysis Division. She can be reached at (613) 951-6379 or doreen.duchesne@statcan.gc.ca.
|
|
|
|
|
[ Highlights ] [ Main menu | Editor's corner | More news | Contact us | Survey information | Back issues ] [ Statistics Canada home page | In depth | Français ] |
|
© Statistics Canada - Conditions of use |