75-001-XIE

 |
May 2003 Vol. 4, no. 5 |
Benefits of the job
Prior to World War I, most employees were paid no more than a straight-time hourly wage. The economic consequences of sickness, accident, or job loss were almost entirely the responsibility of the individual worker (Bauman 1970). Since the 1920s, however, significant economic, social and demographic trends have spurred the creation of many legislated and discretionary non-wage benefits. For example, the economic hardship of the Great Depression helped bring about a mandatory national unemployment insurance program. Inflation and high labour demand during the Second World War prompted employers to offer 'non-inflationary' compensation such as paid vacations, insurance and pensions (Stelluto and Klein 1990). At the same time, a strong and growing labour union movement helped improve wages and benefits for its members.
As non-wage compensation has evolved, employers have needed to remain competitive, enticing and retaining skilled employees with not only wages, but non-wage benefits as well. Are workers who receive non-wage benefits also likely to receive high monetary remuneration? That is, does inequality of benefits parallel inequality of earnings—reinforcing the notion of 'good' and 'bad' jobs?
Some non-wage benefits are mandatory, others discretionary. Employers
are legally obligated to contribute to Employment Insurance, Canada and
Quebec Pension Plans, and workers' compensation—collectively referred
to as payroll taxes (Lin 2000). ![]() 1
Many employers also offer discretionary non-wage benefits, which vary
in cost. These include paid vacation; sick and other leave; employer-sponsored
medical, dental, life and disability insurance; retirement pension or
savings plans; profit-sharing and stock-ownership plans; wellness and
employee assistance programs; and other ad hoc benefits. Overall, non-wage
benefits costs have risen over the past half century and now account for
over one-third of total labour costs (Chart
A).
1
Many employers also offer discretionary non-wage benefits, which vary
in cost. These include paid vacation; sick and other leave; employer-sponsored
medical, dental, life and disability insurance; retirement pension or
savings plans; profit-sharing and stock-ownership plans; wellness and
employee assistance programs; and other ad hoc benefits. Overall, non-wage
benefits costs have risen over the past half century and now account for
over one-third of total labour costs (Chart
A).
More recent trends in non-wage benefits have emerged partly because of demographic changes in the labour force. One significant change has been the increase in dual-earner families, a factor that has led to the creation of an array of benefits catering to the needs of workers and their families. These benefits include on-site or similar child care, leave for care of children or parents, on-site fitness centres, and employee-assistance programs (see Family-friendly practices).
Wage and non-wage compensation are often used as indicators of job quality.
However, other non-monetary job benefits can add to the quality of work,
including workplace safety and cleanliness, job security, ![]() 2
type of work performed, and schedule flexibility. These benefits cannot
be assessed financially, and rating quality is difficult since scoring
is subjective.
2
type of work performed, and schedule flexibility. These benefits cannot
be assessed financially, and rating quality is difficult since scoring
is subjective.
Non-wage benefit compensation may now be commonplace, but is it common to all employees? Using the 2000 Survey of Labour and Income Dynamics (SLID), and other information on job quality, this paper examines employee non-wage benefit coverage rates by a number of personal and job characteristics (see Data sources and definitions).
Six in 10 have at least extended medical
Data on employer-sponsored extended medical, dental, and life/disability insurance show a dichotomy between employees with all three types of insurance (50%) and those with none (38%) (Table 1). For the few (4%) with only one, most had access to extended medical (2%). Another 9% had two, and again the majority (8%) had extended medical. Clearly, insurance benefits appear to come as a package deal. Similarly, almost 4 in 10 self-employed workers had no coverage under any of these insurance plans (Akyeampong and Sussman 2003).
Employer-sponsored retirement plans come in three types: registered
pension plans (RPPs), group registered retirement savings plans (group
RRSPs), and deferred profit-sharing plans (DPSPs) (see Data
sources and definitions). All are designed to replace some level of
employment income upon retirement. RPPs, also known as private pensions,
have existed for decades and are by far the most popular plan type. Annual
RPP membership is measured by the Pension Plans in Canada Survey. In 1999,
5.3 million members (41% of all employees) belonged to 15,557 plans. Similarly,
SLID found that 43% of employees in 1999 and 46% in 2000 reported being
covered by an RPP (Table 1).
![]() 3
SLID also revealed that only 2% of employees reported having an employer-sponsored
group RRSP to which the employer contributed. And 63% of those with a
group RRSP worked in a small- or medium-sized firm (fewer than 100 employees),
compared with only 45% of RPP members.
3
SLID also revealed that only 2% of employees reported having an employer-sponsored
group RRSP to which the employer contributed. And 63% of those with a
group RRSP worked in a small- or medium-sized firm (fewer than 100 employees),
compared with only 45% of RPP members.
Another 9% of employees had the opportunity to participate in a stock-purchase or stock-option plan. This relatively new non-wage benefit grants employees the right to buy company stock at a specified price for a specified period of time. The rules and regulations of these plans can vary widely (Luffman 2003).
About 1 in 12 employees also had the chance to participate in a profit-sharing plan, which in addition to earnings provides financial compensation based on the employer's annual profit. Payment and taxation may be immediate, or deferred and held in trust funds (see Data sources and definitions).
Finally, a small percentage of employees (5%) had access to low-interest loans, and 10% said their employer offered them at least one other important non-wage benefit (not specified). Given that some non-wage benefits are more prevalent than others, the remainder of this article examines coverage rates of employees with all three insurances, and those covered by RPPs, stock options and profit-sharing plans.
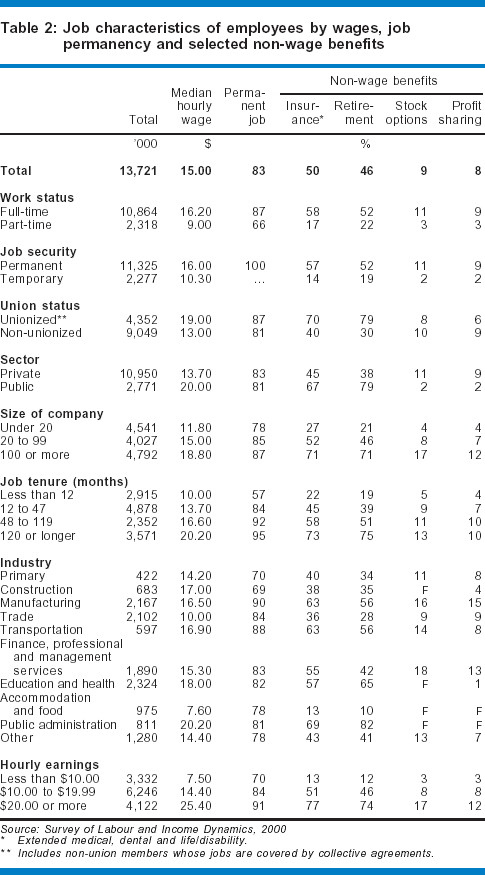
Full-time, permanent and unionized workers have benefit advantage
A number of job characteristics are linked with the incidence of having access to non-wage benefits. For example, roughly 1 in 6 employees working a non-standard work arrangement—part-time or temporary—had all three insurances or RPP coverage, compared with more than half of all full-time and permanent workers (Table 2). These findings support the view that increased competition may lead some employers to purposely use peripheral workers in order to reduce labour costs (Schellenberg 1997).
Also, working in a unionized job not only boosts wages and job security, but also improves access to the more common non-wage benefits of insurance and pension coverage (Fang and Verma 2002). This is partly the result of successful collective bargaining. For example, 79% of unionized employees had an RPP, compared with 30% of the non-unionized. However, the story differs for access to stock options and profit-sharing plans, which was roughly the same for unionized and non-unionized employees alike. Other studies have suggested that 'ownership' benefits have been used by employers to avoid unionization. Similarly, unions themselves have been wary of these types of non-wage benefits, believing that they may be offered in lieu of wage hikes (Coates 1991).
Stock-option and profit-sharing plans were also found predominantly in the private sector, with only 2% of public-sector employers (which include crown corporations) offered this type of non-wage benefit. Stock-option plans in particular are concentrated in the high-tech industry (Luffman 2003); 18% of workers in the finance, professional and managerial services industry had access to this benefit, as did 22% of workers in natural and applied science jobs (data not shown). Although both the public and private sector had equivalent rates of job permanency, public servants were much more likely to be covered by insurance (67% versus 45%) and RPPs (79% versus 38%).
Working for a large company also increased the likelihood of receiving non-wage benefits—71% of those employed in a firm with 100 or more had an RPP, compared with only 21% of those working for a small firm (fewer than 20 employees). Higher unionization rates among larger firms and relatively lower non-wage administration costs (due to economies of scale) are two possible reasons behind these differences (Akyeampong 2002).
The greater the number of years employed in the current job (tenure), the higher the rate of access to all non-wage benefits. Longer-term employees also had higher rates of job permanency and greater earnings.
For the one million workers in the accommodation and food services industry, median hourly earnings were the lowest ($7.60), as were non-wage benefit coverage rates—13% for insurance and 10% for RPPs. In contrast, public administration had an insurance coverage rate of 69%, a RPP rate of 82%, and a median hourly earnings rate of $20.20. Other industries with insurance and pension plan coverage rates at least 10 percentage points below the average were wholesale and retail trade, construction, and primary (agriculture, forestry, fishing and mining).
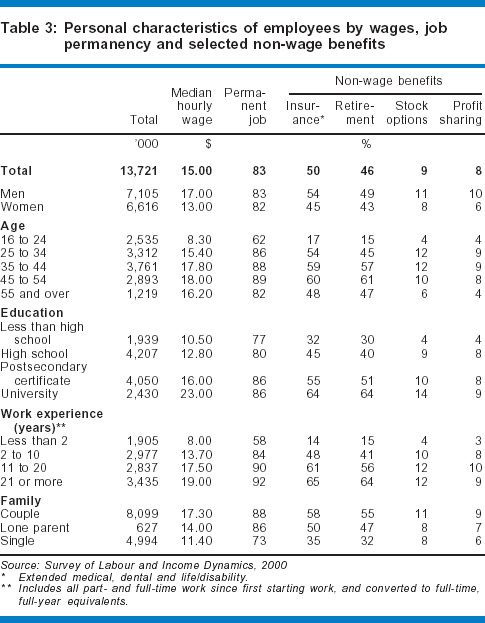
Younger, less educated have fewer perks
Generally, employees were considerably less likely to have access to
non-wage benefits if they were young or single, or had a high school education
or less. For example, only 17% of workers aged 16 to 24 were covered by
all three insurances (medical, dental, life/disability), compared with
48% or higher for those in all older age groups (Table 3).
![]() 4
Furthermore, on average, younger workers had considerably less job security
than those 25 and over (62% held permanent jobs versus at least 82%) and
lower median earnings ($8.30 per hour versus $15.40 or more). Not unexpectedly,
the higher the education level and the more the work experience, the greater
the benefit coverage rate. For example, only one-third of those with less
than high school education had access to retirement and insurance plans,
compared with two-thirds of university graduates. Furthermore, those with
the highest level of education earned more than twice as much as those
with the lowest level ($23.00 versus $10.50).
4
Furthermore, on average, younger workers had considerably less job security
than those 25 and over (62% held permanent jobs versus at least 82%) and
lower median earnings ($8.30 per hour versus $15.40 or more). Not unexpectedly,
the higher the education level and the more the work experience, the greater
the benefit coverage rate. For example, only one-third of those with less
than high school education had access to retirement and insurance plans,
compared with two-thirds of university graduates. Furthermore, those with
the highest level of education earned more than twice as much as those
with the lowest level ($23.00 versus $10.50).
Although women and men had the same rate of job security, women had a median hourly wage of $4 less per hour than men, and a somewhat smaller proportion had access to each type of non-wage benefit. Finally, not only did lone parents earn less per hour than married individuals ($14.00 versus $17.30), they were also less likely to have access to each type of non-wage benefit, including full insurance (50% versus 58%). For parents with dependent children, access to extended medical and dental plans can be very important. Generally, these findings show that workers with lower rates of non-wage coverage were also more likely to have lower median wages and less job security—confirming that stable, well-paying jobs tend to go hand in hand with extra non-wage compensation. Indeed, job characteristics largely determine non-wage compensation coverage rates, and not everyone (as the demographic data in Table 3 show) works in a 'good' job.
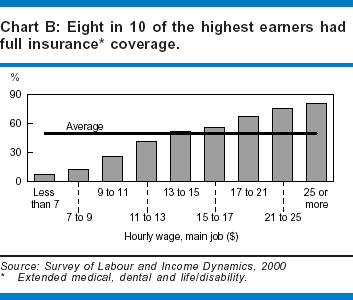
More pay, more benefits
One factor plainly linked with access to non-wage benefits is earnings. Employees who made $20 an hour or more at their job were much more likely than low earners (less than $10 an hour) to have an insurance package (77% versus 13%), an RPP (74% versus 12%), stock options (17% versus 3%), or a profit-sharing plan (12% versus 3%). They were also more likely to have a permanent job (91% versus 70%). As earnings increased, the percentage of employees with access to all types of benefits rose steadily. For example, only 8% of those who earned less than $7 an hour had extended medical, dental, and life/disability insurance, compared with 80% who made $25 or more (Chart B). Furthermore, regression analysis confirmed earnings to be a major factor in determining whether an employee was entitled to full insurance.
Regression ties insurance and RPP coverage to the job
A logistic regression model was used to single out the factors most
affecting access to the two most common benefits: an insurance package
(extended medical, dental and life/disability) and a registered pension
plan. The models tested the effects of each variable on the probability
of receiving either insurance coverage or an RPP, while holding all other
variables constant. Most of the variables expected to affect the chances
of having insurance coverage did so. ![]() 5
5
The results show that earnings were highly significant (<.001 level) and had a large effect on the odds of having insurance and pension coverage. Those who earned $20 or more per hour were 6.1 times more likely to have full insurance, and 3.9 times more likely to have an RPP than those earning less than $10 an hour.
Permanent employees also had significantly higher odds of having coverage than those in temporary jobs, as did full-time workers compared with part-timers. Also, the odds of coverage increased significantly with firm size, with workers in large firms (100 or more) being 3.5 and 4.1 times more likely to have insurance and pension coverage, respectively, than those in small firms (under 20).
Being in a unionized job was a determinant in insurance and pension coverage as well, whereas industry was not a strong factor. (The only industry to have significantly lower relative odds of receiving both full insurance and pension coverage was accommodation and food services.) The effect of unionization was particularly important in terms of pension coverage, where members were 4.9 times more likely to have access than non-members. A union advantage or differential has been found for all components of wage and non-wage compensation, but the greatest is in the category of 'private pension and other benefit plans' (Benjamin, Gunderson and Riddell 1998). Also, further calculations with SLID data show that 89% of unionized public-sector employees and 71% of private-sector unionized employees had an RPP, compared with only 52% of non-unionized public-sector and 29% of non-unionized private-sector employees. Although sector was important, unionization was more so for both insurance and pension coverage.
Finally, time in the current job (tenure) had a greater effect (higher relative odds) for pension than insurance coverage, although both were significant. Since pensions are a form of deferred compensation, employees may be less likely to quit or switch jobs because they would lose their entitlement (Benjamin, Gunderson and Riddell 1998).
Age and sex proved not to be significant factors in benefit access (see Regression model). Although the cross-tabulations showed differences in access rates by age groups, the overriding personal aspects proved to be years of work experience and educational attainment. Both these factors contribute to human capital, and it is argued that those who have more invested in their human capital are more likely to have better jobs, and therefore greater benefits and earnings.
The regression results confirm that non-wage benefit coverage rates in terms of RPP or full insurance coverage are linked with the characteristics of the job and with more accomplished employees. That is, coverage rates are positively related with well-paying, 'good' jobs (unionized, full-time, permanent, and found in large establishments) and with employees having higher levels of education and more years of work experience.
Summary
Non-wage benefits originally emerged in response to, and continue to be affected by, social, economic and demographic issues. Today, employers routinely offer compensation packages beyond salaries and wages, and the trend is not likely to be reversed. Overall, in 2000, half of all employees received extended medical, dental, and life/disability insurance in their job; 46% were covered by a registered pension plan; just under 10% were offered a stock-purchase or profit-sharing plan; and in 1999, almost one-third were given access to at least one type of personal or family support program.
Non-wage benefits are often used by companies to attract and retain good employees, and thereby remain competitive. The results here suggest that employers are striving to retain employees with wage and non-wage benefits combined—that is, high-paying jobs come with full benefits. Employees with good jobs (high-waged, unionized, full-time, and permanent) or in large firms, were much more likely to have access to all types of non-wage benefits than those without these job characteristics. Not surprisingly, workers with higher education levels and more work experience were more likely to be in these high-wage/high-benefit jobs. Conversely, certain groups of employees—for example, those with less than high school education and those in part-time, temporary or non-unionized jobs—are doubly disadvantaged with less access to non-wage benefits and lower hourly wages. Quite simply: the better the job, the better the benefit package.
Data sources and definitionsThe Survey of Labour and Income Dynamics (SLID) is a longitudinal household survey that began in January 1993. Every three years, some 30,000 respondents aged 16 to 69 enter and remain in the survey for six years, completing two detailed questionnaires each year: one on labour market activity and another on income. Beginning in 1999, a number of new questions were added to determine the non-wage benefits of employees. The Workplace and Employee Survey (WES), which began in 1999, is a longitudinal survey of businesses, sampling up to 6,300 workplaces and 24,000 employees within them. All industries are covered except primary and public administration. WES covers a wide range of workplace issues, including employer wage and non-wage benefits. It is currently the only survey to ask about 'family-friendly' practices. Extended medical insurance refers to employer-sponsored medical insurance or health plans that supplement public health-insurance coverage. Dental insurance refers to employer-sponsored dental plans offering some level of dental care service. They can be stand-alone plans or comprehensive plans combining dental and extended medical benefits. Life and/or disability insurance refers to employer-sponsored plans providing financial protection to families in the event of income loss from death or disability. Employer-sponsored pension plans include registered pension plans (RPPs), group registered retirement savings plans (group RRSPs), and deferred profit-sharing plans (DPSPs). These plans are registered with the Canada Customs and Revenue Agency (CCRA) and must follow standard tax and pension rules. The focus of this article is on RPPs. Although SLID does not differentiate, two main types of RPPs exist—defined-benefit plans and defined-contribution plans. Pension Plans in Canada data from 2000 show that 85% of RPP members belong to a defined-benefit plan (Statistics Canada 2001). Stock-purchase or stock-option plans refer to the variety of schemes giving an employee the option to buy a certain number of shares in the company. For more information, see Luffman, 2003. Profit-sharing plans enable an employee to benefit financially from their company's profits. Plans fall into three types: cash distribution profit-sharing plans; employee profit-sharing plans; and deferred profit-sharing plans, which are a type of employer-sponsored pension plan (see above). The first is the most common type of profit-sharing plan; it provides periodic cash payments and does not require registration with the CCRA. The remaining plans provide deferred compensation and taxation and are registered with the CCRA. A fourth type of profit-sharing scheme is a registered profit-sharing pension plan, which is an RPP and operates as such. The target population for this paper includes all persons who did some paid work in 2000. All information regarding non-wage benefit coverage and job characteristics is derived from the respondent's main paid job in 2000. The main job is defined as the one with the most scheduled hours in the year. Respondents were asked only whether their employer offered the non-wage benefit, and not whether they took up the offer. Furthermore, no information is provided as to whether or not the employee had to pay for some of the cost of these benefits. |
Family-friendly practicesThe steady rise in the number of dual-earner and lone-parent families, as well as families with aging parents, has created a need for employers to help workers balance and manage their work and family lives. Thus, there has been an increase in programs offering child care and elder care support. Non-work stress from family and other responsibilities has also led to the development of programs that help to keep workers mentally and physically healthy—such as counselling services through employee assistance, or exercise classes at on-site fitness centres. Although employers are often looking for ways to cut costs, adding family-friendly support programs can be cost-effective since they have the potential to increase worker morale and productivity as well as to reduce absenteeism caused by family and personal problems. Findings from the Workplace and Employee Survey (WES) show that in 1999 almost one-third of employees were offered some type of personal or family support program or service (Table). The two most common were employee assistance (28%) and fitness and recreation (14%). Of employees offered these benefits, 9% used employee assistance at least once in the past year, and 37% used a fitness-related program. The high fitness participation rate means some 570,000 workers exercise through work, suggesting an emerging trend of taking not only a briefcase to work, but a gym bag as well. Only 6% of employees were offered on-site child care or assistance with external suppliers, and 4% were offered elder care. Unlike job-related, non-wage benefits such as employer-sponsored insurances and pension plans, where coverage differences are greater between women and men, employer-sponsored personal and family support programs are more evenly dispersed. The key factor is that family-friendly programs occur at the level of the workplace. Therefore, benefits such as a fitness centre are more likely to be offered to all levels of wage earners and to all occupational groups, including part-time and full-time workers alike. That said, a slightly higher percentage of men were offered at least one support program at work (33% versus 29%), implying differences in the mix of employees at workplaces that offer these programs. |
Notes
- The cost of payroll taxes to employers rose from 5% in 1961 to 11% in 2000.
- Persons are said to have job security if they are in a permanent job. It is assumed that a permanent job is generally more secure than a temporary one, but job permanency does not necessarily prevent layoff.
- Current group RRSP and DPSP memberships are not known from any source other than SLID. However, past research estimated group RRSP membership (with and without employer contributions) to be more than 700,000 in 1995, and it suggested that the numbers were growing. DPSPs were found to be 'less significant' than group RRSPs, in terms of both number of plans and membership (Frenken 1996).
- Almost one in five of the paid workers in this study were students for some time in 2000, either full- or part-time. Some 63% of these employed students were under 25 and hence may not have been too interested in non-wage benefits, such as a company pension plan, and may even have sought short-term, non-permanent work. For them, lower-paying, non-benefit jobs may not be seen as a hardship. However, these distinctions cannot be made with the data, and so all persons with jobs, regardless of student status, were included.
- Similar results were found in an analysis of health and dental insurance coverage using the 1995 Survey of Work Arrangements. For more information, see Reesor and Lipsett, 1998.
References
- Akyeampong, Ernest B. 2002. "Unionization and fringe benefits." Perspectives on Labour and Income (Statistics Canada, Catalogue no. 75-001-XIE) 3, no. 8. August 2002 online edition.
- Akyeampong, Ernest B. and Deborah Sussman. 2003. “Health-related insurance for the self-employed.” Perspectives on Labour and Income (Statistics Canada, Catalogue no. 75-001-XIE) 4, no. 5. May 2003 online edition.
- Bauman, Alvin. 1970. "Measuring employee compensation in U.S. industry." Monthly Labor Review (October): 17-24.
- Benjamin, Dwayne, Morley Gunderson and Craig Riddell. 1998. Labour market economics: Theory, evidence, and policy in Canada. Toronto: McGraw-Hill Ryerson.
- Coates III, Edward M. 1991. "Profit sharing today: Plans and provisions." Monthly Labor Review (April): 19-25.
- Fang, Tony and Anil Verma. 2002. "Union wage premium." Perspectives on Labour and Income (Statistics Canada, Catalogue no. 75-001-XIE) 3, no. 9. September 2002 online edition.
- Frenken, Hubert. 1996. "Pension fact or fiction?" Perspectives on Labour and Income (Statistics Canada, Catalogue no. 75-001-XPE) 8, no. 2 (Summer): 22-25.
- Lin, Zhengxi. 2000. "Payroll taxes—recent trends." Perspectives on Labour and Income (Statistics Canada, Catalogue no. 75-001-XPE) 12, no. 3 (Autumn): 21-31.
- Luffman, Jacqueline. 2003. "Taking stock of equity compensation. " Perspectives on Labour and Income (Statistics Canada, Catalogue no. 75-001-XIE) 4, no. 3. March 2003 online edition.
- Reesor, Mark and Brenda Lipsett. 1998. Employer-sponsored health and dental plans—Who is insured? Publication no. W-98-2E. Ottawa: Applied Research Branch, Human Resources Development Canada.
- Schellenberg, G. 1997. The changing nature of part-time work. Social Research Series, no. 4. Ottawa: Canadian Council on Social Development.
- Statistics Canada. 2001. Pension plans in Canada. Catalogue no. 74-401-XPB and 74-401-XIB. Ottawa.
- Stelluto, George L. and Deborah P. Klein. 1990. "Compensation trends into the 21st century." Monthly Labor Review (February): 38-45.
Author
Katherine Marshall is with Labour and Household Surveys Analysis Division. She can be reached at (613) 951-6890 or perspectives@statcan.gc.ca.
|
|
|
|
|
[ Highlights ] [ Main menu | Editor's corner | More news | Contact us | Survey information | Back issues ] [ Statistics Canada home page | In depth | Français ] |
|
© Statistics Canada - Conditions of use |