75-001-XIE

 |
October 2001 Vol. 2, no. 10 |
After the layoff
Diane Galarneau and Lori M. Stratychuk
Labour turnover is a major aspect of the Canadian labour market. Year after year, one-third of workers quit their job or are laid off, either permanently or temporarily. The 1990s were characterized by a general feeling of job insecurity. However, this feeling is not supported by the data. While some groups were more susceptible to layoffs and short-term employment, the average trends were fairly similar to those observed in the 1980s (Picot and Lin, 1997).
One little-studied aspect concerns the consequences of layoffs: How long does it take a permanently laid-off person to find a new job? What factors determine how long a jobless period lasts? What is the wage gap between a new job and the old one? What factors influence this gap? To answer these questions, this article uses the Survey of Labour and Income Dynamics (SLID) to examine permanent layoffs from full-time jobs between 1993 and 1998 (see Data source and definitions).
Who gets laid off?
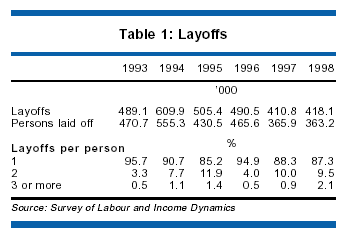
From 1993 to 1998, the annual number of layoffs ranged between 411,000 and 610,000 (Table 1). ![]() 1 Since there is usually a time lag between an economic recovery and a turnaround in employment, it was not until 1995, three years after the 1992 recession, that a sizeable decrease occurred in the number of permanent layoffs (17% between 1994 and 1995). However, while permanent layoffs are sensitive to economic cycles, they are less so than temporary layoffs, quits and hirings (Picot, Lin and Pyper, 1997). In an economic downturn, employers tend to resort more frequently to temporary layoffs, attrition and reduced hiring in an effort to reduce labour costs. By the same token, in a period of growth, employers tend to call back workers laid off temporarily and hire new employees. Also, greater numbers of dissatisfied workers are tempted to try their luck elsewhere, resulting in increased hirings and quits.
1 Since there is usually a time lag between an economic recovery and a turnaround in employment, it was not until 1995, three years after the 1992 recession, that a sizeable decrease occurred in the number of permanent layoffs (17% between 1994 and 1995). However, while permanent layoffs are sensitive to economic cycles, they are less so than temporary layoffs, quits and hirings (Picot, Lin and Pyper, 1997). In an economic downturn, employers tend to resort more frequently to temporary layoffs, attrition and reduced hiring in an effort to reduce labour costs. By the same token, in a period of growth, employers tend to call back workers laid off temporarily and hire new employees. Also, greater numbers of dissatisfied workers are tempted to try their luck elsewhere, resulting in increased hirings and quits.
The downward trend in the layoff rate, which fell from 4.9% in 1993 to 3.6% in 1998, reflects the gradual improvement in labour market conditions. From 1993 to 1998, gross domestic product expanded and the unemployment rate followed a downward trend (Chart A).
The layoff rate was higher for men, youths (aged 16 to 24), workers with less education, workers in the Atlantic provinces and Quebec, rural workers, people living alone, and those with no children at home (Table 2). ![]() 2 The rate was also higher when the spouse was earning a low income.
2 The rate was also higher when the spouse was earning a low income. ![]() 3 Workers not subject to a collective agreement as well as those working in small firms also had relatively high rates. In general, the layoff rate was higher in construction occupations
3 Workers not subject to a collective agreement as well as those working in small firms also had relatively high rates. In general, the layoff rate was higher in construction occupations ![]() 4 and lower for managers and professionals (Table 3). It was also higher for persons whose lost job had been short-lived and for low-wage workers. The rate of layoff declined as the hourly wage increased.
4 and lower for managers and professionals (Table 3). It was also higher for persons whose lost job had been short-lived and for low-wage workers. The rate of layoff declined as the hourly wage increased.
The higher layoff rates in small firms are explained by the different characteristics of their employees-the employees of large firms are generally more educated, older, more experienced, and more often unionized. Also, small firms tend to be less stable and more likely to go out of business, accounting for a sizeable proportion of permanent layoffs (Picot, Lin and Pyper, 1997).
What happens after the layoff?
The consequences of layoffs were examined using the longitudinal sample of SLID (see Data source and definitions). The analysis was confined to layoffs of persons with at least one year of tenure in the lost job in order to focus on the population of interest: workers with strong ties to the labour market. ![]() 5
5
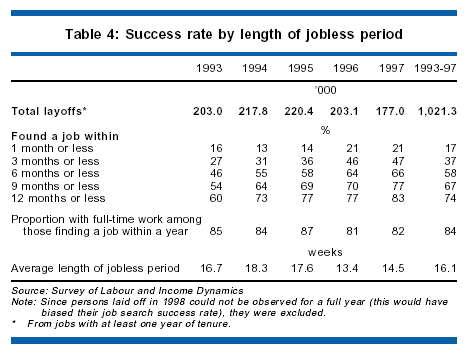
For certain people laid off between 1993 and 1997, the jobless period was relatively short; 13% to 21% of layoffs ended in a new job in one month or less (Table 4). For all years combined, in 8% of layoffs the jobless period lasted no more than one week, with some persons finding a job even before they were laid off. The proportion of layoffs that ended in twelve months or less increased over the years, from 60% in 1993 to 83% in 1997 (Chart B). ![]() 6 This reflects the more favourable conditions at the end of the study period and a more rapid adjustment on the part of workers. This trend of individuals finding a new job more quickly after layoff is reflected in the average jobless duration, which peaked at 18.3 weeks in 1994, and then decreased in the following years. Among those who found a job within a year, about 84% secured one that was full-time. This rate was comparable to the proportion of full-time workers in the labour force (81% according to the Labour Force Survey).
6 This reflects the more favourable conditions at the end of the study period and a more rapid adjustment on the part of workers. This trend of individuals finding a new job more quickly after layoff is reflected in the average jobless duration, which peaked at 18.3 weeks in 1994, and then decreased in the following years. Among those who found a job within a year, about 84% secured one that was full-time. This rate was comparable to the proportion of full-time workers in the labour force (81% according to the Labour Force Survey). ![]() 7
7
One year later
One year after a layoff, almost one-fifth of the individuals were unemployed-either they had not yet found a new job or they had lost their new job. The unemployment rate for laid-off workers was 23.3%-disproportionately high compared with the total labour force, which averaged 10.0% from 1993 to 1997 (Table 5). The rate for laid-off workers varied from year to year, peaking in 1993 at 32.8% and reaching a low of 18.6% in 1996. ![]() 8
8
An examination of labour force status one year after layoff shows that 83% of those who found a job within a year were still employed, whereas 9% were unemployed, and 8% were not in the labour force. This reduced the success rate after one year from 74% to 62%. The unemployment rate for those who found a job within a year (9.8%) was therefore comparable to that of the labour force as a whole (10.0%). Among those who did not find a job, a sizeable proportion (53%) were not in the labour force and 47% were unemployed.
The unemployment rate of laid-off workers varied considerably by age, with the highest rate among those aged 55 and over (45.8%). For the labour force as a whole, the rate also showed considerable variation, but generally declined with age. The rate for the 55-and-over age group was only 7.9%.
The unemployment rate was also higher for laid-off workers with a low education level-29.1% for persons with less than a high-school diploma, compared with 20.9% for those with a post-secondary degree or higher. For the labour force as a whole, the corresponding figures were 15.8% and 7.8%. One year after their layoff, managers and professionals had the lowest unemployment rate (15.3%).
A small proportion of persons (just over 13%) returned to school after their layoff. They tended to be younger (49% were under 35 compared with 37% for those who did not return to school), more educated (87% compared with 73% had at least completed high school-probably because they were younger), and more frequently in occupations requiring fewer skills such as clerical; service; or product fabricating, assembling and repairing. On the other hand, persons who did not return to school were more often managers and professionals. A small proportion of all laid-off persons (3%) returned to school full time.
What influences the duration of joblessness?
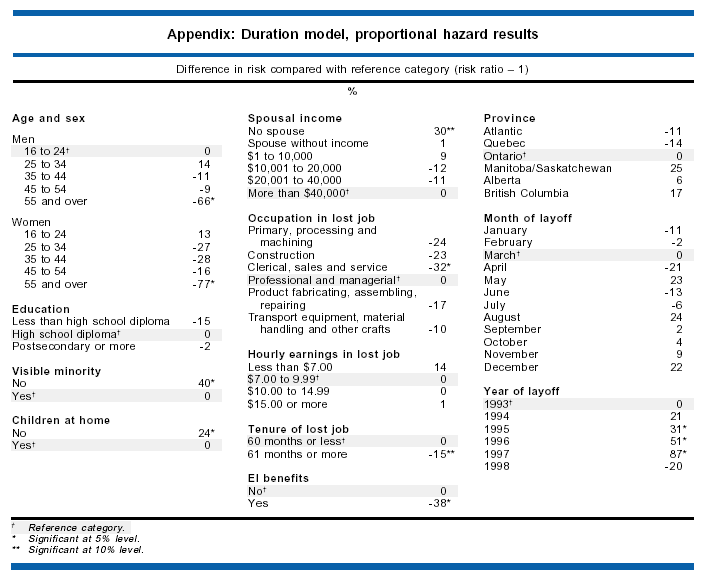
The duration of joblessness following layoff varied. A proportional hazards model was used to isolate the effect of various factors. To analyze these factors, a duration model was estimated. The duration of joblessness varied by sex, age, presence of children, presence of a spouse, occupation, receipt of unemployment insurance benefits, tenure in the lost job, visible minority status, and the year of the layoff. ![]() 9
9
Personal characteristics
Being a man over 54 reduced the chance ![]() 10 of finding a new job by 66% in relation to men aged 16 to 24-older workers may be perceived as being too close to retirement, or their skills may be considered outdated. Being a woman over 54 reduced the chance of finding a new job even more-by 77% in relation to men aged 16 to 24. The general pattern observed was that the chance of finding another job decreased as age increased (once again, in relation to men aged 16 to 24). However, in all age groups, the chance was always smaller for women than for men. This may be attributable to men's closer ties to the labour market.
10 of finding a new job by 66% in relation to men aged 16 to 24-older workers may be perceived as being too close to retirement, or their skills may be considered outdated. Being a woman over 54 reduced the chance of finding a new job even more-by 77% in relation to men aged 16 to 24. The general pattern observed was that the chance of finding another job decreased as age increased (once again, in relation to men aged 16 to 24). However, in all age groups, the chance was always smaller for women than for men. This may be attributable to men's closer ties to the labour market.
Living alone or having no children-two factors likely to increase mobility-tended to increase the chances of finding a new job by 30% and 24% respectively. The spouse's income level had no effect.
Occupation and length of service
In comparison with the reference category-managers and professionals-most occupations associated with a lost job had little influence on the duration of joblessness. The exceptions were clerical, sales and service, where the chance of finding a new job at any time after layoff was 32% lower than for managers and professionals. Various explanations are possible. Clerks, salespersons and service workers may have a lower degree of skill transferability compared with managers and professionals. This could make their skills seem less valuable to potential employers and reduce their chances of getting a job. This lower transferability could also reflect a lower versatility. Less versatile workers have a smaller range of skills, which can reduce job opportunity. Also, clerks, salespersons and service workers appeared to have weaker ties to the labour force-20% were out of the labour force one year after layoff compared to 6% of managers and professionals. This weaker tie may reflect a lower job-search intensity.
Greater tenure in the lost job reduced the probability of finding a new job by 15%. It could be that workers who stay in a job longer tend to have skills specific to their employer, and these may sometimes be hard to transfer. In addition, such individuals may be unfamiliar with job-searching and could take longer to find a new job.
Employment Insurance benefits
The receipt of Employment Insurance (EI) benefits reduced the chances of finding a job by 38%. EI benefits may be associated either with a job search that is initially less intense or with an extended search in hopes of finding more suitable work. EI benefits had a major effect on the length of the jobless period. Among persons not receiving benefits, nearly two-thirds found a job in three months or less, compared with 30% of those with benefits. Since EI benefits are of limited duration, their effect declines over time, with the result that a comparable proportion of claimants and non-claimants found a job in twelve months or less (Chart C).
Visible minorities
Being a member of a visible minority reduced the chances of finding a new job. ![]() 11 A number of these persons were immigrants who had come to Canada fairly recently (nearly a third after 1985). Many of them may have been in the process of integrating into the Canadian labour market or in training (in language courses or courses taken to gain recognition of their degrees). At first, some may have accepted jobs not compatible with their qualifications, and then later searched for a more suitable job.
11 A number of these persons were immigrants who had come to Canada fairly recently (nearly a third after 1985). Many of them may have been in the process of integrating into the Canadian labour market or in training (in language courses or courses taken to gain recognition of their degrees). At first, some may have accepted jobs not compatible with their qualifications, and then later searched for a more suitable job.
Year of layoff
Some years were more conducive to a successful job search than others-for example, 1995 to 1997 compared with 1993. The years 1995 to 1997 had lower unemployment rates and were characterized by robust economic growth (Chart A). Some of the years in the study period also coincided with the reform of the Employment Insurance program. The improvement observed toward the end of the study period could be partly attributable to this reform. Starting in 1996, the eligibility rules were tightened, the entitlement period was reduced, ![]() 12 and the way of calculating benefits was changed. These changes may have induced some laid-off persons to intensify their job search.
12 and the way of calculating benefits was changed. These changes may have induced some laid-off persons to intensify their job search.
Other characteristics such as education level, earnings in the lost job, and the month of the layoff did not have any significant effect on the probability of finding a new job.
Wages before and after layoff
In the job following layoff, 21% of workers received a wage that was equal (plus or minus 5%) to the wage in the lost job, while 47% received a lower wage and 32% received a higher wage (Table 6). Regardless of the year of the layoff, more people experienced a wage loss in the new job. For those experiencing a loss, the average loss was nearly 30%; for those experiencing a gain the average increase was just under 26%. In all, 21% of layoffs were followed by wage losses of more than 30%, while only 14% were followed by gains of more than 30%.
Estimates show that the wage gap was sensitive to the wage in the lost job. ![]() 13 Persons with a higher wage were more likely to suffer a loss; those in low-paying jobs had a better chance of a wage gain in their new job (Chart D). This effect was observed earlier (Picot and Wannell, 1987; Picot and Pyper, 1993). According to Picot and Pyper, "Wage change may also be negatively correlated with the wage level in the lost job simply because the higher the wage, the less likely is a very large wage gain. There is a limit to the wages most firms are willing to pay (for a given level of human capital). Similarly, for very low wage jobs large wage losses are unlikely because there is a minimum wage restriction. These considerations may lead to a regression to the mean phenomenon."
13 Persons with a higher wage were more likely to suffer a loss; those in low-paying jobs had a better chance of a wage gain in their new job (Chart D). This effect was observed earlier (Picot and Wannell, 1987; Picot and Pyper, 1993). According to Picot and Pyper, "Wage change may also be negatively correlated with the wage level in the lost job simply because the higher the wage, the less likely is a very large wage gain. There is a limit to the wages most firms are willing to pay (for a given level of human capital). Similarly, for very low wage jobs large wage losses are unlikely because there is a minimum wage restriction. These considerations may lead to a regression to the mean phenomenon."
The characteristics of the new job also affected the wage gap; for example, if the job was full-time, ![]() 14 unionized, or if the occupation was the same as in the lost job, the wage in the new job tended to be higher. The skill level associated with the occupation also affected the wage gap. Managers and professionals as well as construction workers were more likely to report a wage gain in the new job (in comparison with the reference category other occupations: transport equipment operators, material handlers, and other crafts). However, the wage gap showed no relationship to the length of the jobless period or the worker's education level.
14 unionized, or if the occupation was the same as in the lost job, the wage in the new job tended to be higher. The skill level associated with the occupation also affected the wage gap. Managers and professionals as well as construction workers were more likely to report a wage gain in the new job (in comparison with the reference category other occupations: transport equipment operators, material handlers, and other crafts). However, the wage gap showed no relationship to the length of the jobless period or the worker's education level. ![]() 15 Furthermore, family characteristics such as having children or having a spouse with no income had no more effect on the wage gap than did the year of the layoff.
15 Furthermore, family characteristics such as having children or having a spouse with no income had no more effect on the wage gap than did the year of the layoff.
Summary
This study examined what happens after a person is laid off from a full-time job. The layoff rate was higher for men, youths (aged 16 to 24), workers with less education, construction workers, workers not covered by a collective agreement, and workers in small firms. The rate was also higher for individuals whose lost job was short-term and for low-wage workers. Persons living alone and those with no children at home also had a relatively high layoff rate. Conversely, the layoff rate was low for managers and professionals.
For some people, the jobless period was relatively short-for 8%, one week or less. The proportion of layoffs that ended in a job (within a year) averaged 74%. The proportion increased over the years, from 60% in 1993 to 83% in 1997. This reflects the more favourable economic conditions at the end of the study period and a more rapid adjustment on the part of workers. Nonetheless, one year after a layoff some of those who had found a new job also lost it. Accordingly, the job search success rate declined to 62%.
One year after a layoff, almost one in five laid-off workers were unemployed-they had not yet found a job, or they had lost their new job. Laid-off persons therefore had disproportionately high unemployment rates-over 23% one year later-compared with the labour force as a whole, for which the rate averaged 10% between 1993 and 1997. The unemployment rate of laid-off workers varied according to the year, peaking at 32.8% in 1993 and reaching a low of 18.6% in 1996.
The chance of finding a job-regardless of the number of weeks after layoff-was lower for persons aged 55 and over; women; persons working as clerks, salespersons or in service occupations; Employment Insurance claimants; members of visible minorities; and persons who had worked for a long time for one employer. Having children no at home, living alone, working as a manager or professional, or being laid off between 1995 and 1997 tended to increase the chance of finding a new job. Neither education level nor wage level of the lost job had any significant effect.
Regardless of the year of layoff, more people suffered a wage loss in their new job. Average wage gains and losses were relatively high-26% and 30% respectively. A major factor determining the size of the wage gap was the wage in the lost job. The higher the wage in the lost job, the more frequent the loss in the new job; conversely, the lower the wage in the lost job, the more frequent the gain in the new job. The wage gap also depended on the characteristics of the new job. For example, if the new job was full-time or unionized, or if the occupation was the same as for the lost job, the wage tended to be higher than for the lost job. The skill level associated with an occupation also affected the wage gap-managers and professionals as well as construction workers had a better chance of a gain in their new job.
Data source and definitionsThe Survey of Labour and Income Dynamics (SLID) is a longitudinal survey that was launched in 1993; it also provides cross-sectional estimates. The first part of thearticle is based on the cross-sectional sample of SLID, and examines the number and rate of layoffs for each year. The second part of the article uses the longitudinal sample, and focuses on what happens after a permanent layoff. Estimates from the cross-sectional sample are weighted in order to be representative of the Canadian population (excluding individuals under 16 and those living in the Territories, Indian reserves, military bases, or in institutions) for each year. On the other hand, the longitudinal sample is representative of the population at December 1992. From 1993 to 1995, the longitudinal sample of SLID was based on a single panel, consisting of 15,000 households representing approximately 30,000 persons. With the 1996 introduction of a second panel, SLID now covers 30,000 households (60,000 persons). Longitudinal sampleAll estimates concerning the length of the joblessperiod are based on the longitudinal sample from SLID. Only persons who were laid off at least once between January 1993 and December 1998 and who answered the SLID questionnaire in all six years were selected. The sample population represents the population as of December 31, 1992. The unit of analysis is the layoff (and not the person); all layoffs experienced by a given person are counted separately. The probability of finding a job at any time after layoff was estimated using the Cox proportional hazards model, which takes account of censored values. For example, if a person laid off in 1998 had not found a job by the end of the year, the associated information could be incorporated into the model, as could information relating to persons who had not found a job more than one year after layoff. The model for the wage gap was estimated only for those individuals who found a job within a year. This model was estimated by ordinary least squares. LayoffsThe layoffs covered by this study are those thatoccurred for structural or cyclical reasons-the company moved, the company went out of business, a business slowdown occurred, or the employee was dismissed. Since a person who is laid off must first have been an employee, the self-employed were excluded, as were full-time students who simultaneously held a full-time job or attended an educational institution for at least eight months during the year. Layoffs from a temporary or seasonal job were also excluded, since workers in such jobs expect them to end after a specified period. Likewise, layoffs of persons with more than one job for more than one week were excluded, the reasoning being that if such people were laid off from one of their jobs, they would not feel the same urgency to replace it. However, a transition period was permitted to allow for people who found a new job the week before or after being laid off. Only permanent layoffs from a full-time job were counted in order to observe the behaviour of workers with strong ties to the labour market. Whether a layoff is permanent or temporary depends upon the perception of the respondent. People were counted more than once if they had more than one layoff. This provides a more complete picture of the characteristics of the jobs in which layoffs occurred-by industry, occupation, union status, wage level, or length of employment. This is not a double count since the layoffs took place at different times. People's characteristics may also have changed in the interim: they will have aged, their education level may have increased, or their experience may have become more diversified. However, most persons were laid off only once in the six years covered by this study. The layoff rate is the ratio of permanent layoffs from full-time jobs to total full-time jobs held for one year,excluding self-employed persons and full-time students. This rate was compiled for each year. |
Notes
- This part of the study is based on the cross-sectional sample.
- The characteristics of laid-off persons are as of December 31 of the year of the layoff.
- Earlier studies noted similar trends (Picot and Wannell, 1987; Picot and Pyper, 1993; Picot and Lin, 1997). It would appear that the last in are also the first out. Various theories on labour turnover explain this phenomenon, such as those based on human capital concepts (Parsons, 1972) or job matching (Jovanovic, 1979). According to Parsons' theory, the employee acquires experience and the employer invests in the employee so that, over time, the probabilities of a quit or dismissal diminish. In job matching described by Jovanovic, at the outset the employee and the employer have limited knowledge of each other. Over time, the employer-employee match is more solid, thereby reducing the probability of a quit or dismissal.
- This was found despite the exclusion of seasonal and temporary workers. While construction workers are often laid off temporarily, these results suggest that permanent layoffs are also sizeable for this occupation. However, it is possible that a certain number of seasonal workers were inadvertently included in the survey universe.
- Persons with only a few months of job tenure might have a profile similar to that of sporadic workers. A sizeable proportion of layoffs occurred in short-term jobs; in fact, nearly a third of laid-off persons had been in jobs that lasted less than four months. Confining the analysis to layoffs of jobs lasting more than one year meant that 56% of layoffs were excluded. With this restriction, a larger proportion of laid-off persons (97%) had only one layoff between 1993 and 1998. For all layoffs, the corresponding proportion averaged 91%.
- The overall success rate-that is, where no time restriction was imposed-was obviously higher. It ranged between 85% and 89%. However, this success rate was influenced by the year of the layoff-people laid off in 1993 had five years to find a job, whereas those laid off in 1997 had only one year. So that the average duration of joblessness would not be influenced by the year of the layoff, the rate was calculated only for persons who found a new job within a year. The year 1998 was therefore excluded from these calculations; however, it was included in the duration model.
- In the Labour Force Survey, the proportion (81%) refers to the number of individuals while in SLID the proportion is based on the number of jobs. However, since 97% of all individuals had only one layoff, the results may be compared.
- According to Picot and Wannell (1987), the post-layoff unemployment rate for the period from 1982 to 1985 was 24.9%. However, that period differs from the study period in that it began with a recession and ended with an expansion, whereas the period from 1993 to 1997 fell within the economic upswing that followed the 1992 recession. It is therefore difficult to compare unemployment rates for the two periods. Also, the rate obtained by Picot and Wannell was the one at the time of the survey in January 1986; this was not necessarily the rate one year after the layoff, since the layoffs occurred between 1981 and 1984. The unemployment rate for workers laid off from a full-time job in 1988 (without restriction as to the number of months or years of tenure in the lost job) was 17.6%, slightly lower than the rate for 1996 (Picot and Pyper, 1993). The years 1988 and 1996 differed as to the unemployment rate (7.8% and 9.6% respectively) and GDP growth rate (4.9% and 1.5%). However, both years fell during phases of expanding GDP and declining unemployment. The study by Picot and Wannell focused on layoffs from full-time jobs, without restriction as to the length of employment. This differs from the definition used in the present study, which deals with layoffs from a full-time job held for at least one year.
- The model on the duration of the jobless period included the following variables: sex, age, province of residence, education level and family status (presence of children, presence of a spouse and spouse's income where applicable) of the laid-off person; characteristics of the lost job (occupation, hourly wage and length of employment); receipt of Employment Insurance benefits; and some characteristics of the layoff, such as the year or month in which it occurred. Other variables were also tested (such as the union status of the lost job, or living in a rural or urban area). None of these yielded conclusive results. Furthermore, since not all provinces were in the same phase of the economic cycle, a variable combining the effect of the year and the province was also tested without any significant results. The detailed results are shown in the appendix.
- The technically correct term for a proportional hazards model is risk. To avoid the negative connotation of this word, the more common term chance is used. See analysis by Allison (1995).
- Only 8% of jobs from which people were laid off were held by members of a visible minority; therefore, caution should be exercised in drawing any conclusions.
- Before June 30, 1996, claimants could receive benefits for up to 50 weeks, depending on the unemployment rate in their region and how long they had been employed. The new legislation reduced the entitlement period to 45 weeks. Since in this study persons laid off had to have at least one year of tenure in the lost job, they qualified for the maximum number of weeks of benefits, based on the unemployment rate in their region.
- Models of the wage gap commonly use the logarithm of the ratio of the new wage to the old wage. This approach was used here. Detailed results are available from the authors.
- This relationship was unexpected, since the layoffs studied were restricted at the outset to persons with a full-time job.
- In the study by Picot and Pyper (1993), the wage gap exhibited the same relationship with the change-of-occupation variable and with the length of the job search. Unlike the results of the present study, the wage gap was affected by education level.
References
- Allison, P. Survival analysis using the SAS system: a practical guide. Cary N.C.: SAS Institute, 1995.
- Jovanovic, B. "Job matching and the theory of turnover." The Journal of Political Economy 87 no. 5, Part 1 (October 1979): 972-990. (http://www.jstor.org/).
- Lin, Z. and W. Pyper. "Job turnover and labour market adjustment in Ontario from 1978-1993." Statistics Canada Research Paper Series no. 106 (Catalogue no. 11F0019E no. 106), Analytical Studies Branch. Ottawa, 1997.
- Parsons, D. "Specific human capital: an application to quit rates and layoff rates." The Journal of Political Economy 80, no. 6 (November-December 1972): 1120-1143. (http://www.jstor.org/).
- Picot, G. and Z. Lin. "Are Canadians more likely to lose their jobs in the 1990s?" Statistics Canada Research Paper Series no. 96 (Catalogue no. 11F0019MPE no. 96), Analytical Studies Branch. Ottawa, 1997.
- Picot, G., Z. Lin and W. Pyper. "Permanent layoffs in Canada: overview and longitudinal analysis." Statistics Canada Research Paper Series no. 103 (Catalogue no. 11F0019E no. 103), Analytical Studies Branch. Ottawa, 1997.
- Picot, G. and W. Pyper. "Permanent layoffs and displaced workers: cyclical sensitivity, concentration, and experience following the layoff." Statistics Canada Research Paper Series no. 55 (Catalogue no. 11F0019E no. 55), Analytical Studies Branch. Ottawa, 1993.
- Picot, G. and T. Wannell. "Job loss and labour market adjustment in the Canadian economy." Statistics Canada Research Paper Series no. 5 (Catalogue no. 11F0019E no. 5), Analytical Studies Branch. Ottawa, 1987.
Appendix |

Authors
Diane Galarneau is with the Labour Statistics Division. She can be reached at (613) 951-4626 or diane.galarneau@statcan.gc.ca.
Lori M. Stratychuk is with the Household Survey Methods Division. She can be reached at (613) 951-0380 or lori.stratychuk@statcan.gc.ca.
|
|
|
|
|
[ Highlights ] [ Main menu | Editor's corner | More news | Contact us | Survey information | Back issues ] [ Statistics Canada home page | In depth | Français ] |
|
© Statistics Canada - Conditions of use |