 |
|
 |                |
Archived ContentInformation identified as archived is provided for reference, research or recordkeeping purposes. It is not subject to the Government of Canada Web Standards and has not been altered or updated since it was archived. Please contact us to request a format other than those available. |

| January 2004 |
The labour market in 2003 Geoff Bowlby
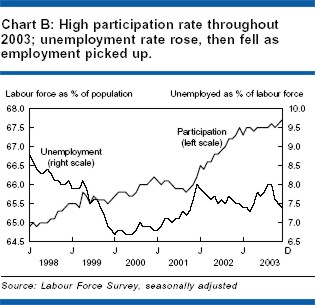
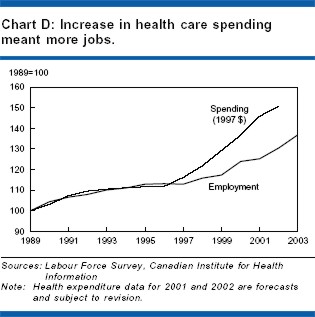
Following a tremendous gain in employment the previous year, 2003 got off to a slow start. During the first eight months, employment growth was minimal. Over the year, the economy was rocked by a rapidly rising Canadian dollar, and probably to a lesser extent by war in Iraq, the SARS scare, and the Ontario-U.S. power outage. The last time the labour market saw such a sustained period of weakness was in 2001, when Canada narrowly avoided a recession. However, employment surged forward during the last four months, and in the end the labour market salvaged some modest improvement for the year (Chart A). On average, just over 15.7 million people were employed in 2003, up 334,000 (2.2%) from 2002. At 62.4% of the working-age population, this was the highest annual employment rate on record. Much of the gain in the last four months was in full-time work. For the year, there were 253,000 more full-time workers than the year earlier, an increase of 2.0%. Part-time increased 81,000 (2.8%). While participation rates remained at historical highs throughout the year, the unemployment rate rose at the start of the year, when employment growth was weak, but fell at the end (Chart B). For the year, it averaged 7.6%, down marginally from 2002. Employment buoyed by new housing and re-salesWith continued low mortgage interest rates driving demand and low stocks of homes available to a growing number of buyers, construction was robust throughout 2003 (Chart C) and on its way to the most housing starts since the late 1980s. The continued strength of the housing sector helped employment gains in 2003. On average, construction employment in 2003 was 49,000 (5.5%) higher than in 2002. As a spin-off, employment in finance, insurance and real estate was 41,000 higher (4.5%) than in 2002, with most of the gain in real estate. Added construction and real estate jobs led to a second consecutive gain in self-employment. In 2003, self-employment increased 67,000 following a gain of 37,000 in 2002. Prior to this, self-employment had been on a downward trend, falling 154,000 between 1999 and 2001. More health care and social assistance employmentWith health-care spending tracking upward, health-care and social-assistance employment continued to grow in 2003 (Chart D), much of it concentrated in Ontario and Quebec. For the year, employment in the industry increased 77,000 from the average in 2002. Since 1996, health-care spending in Canada has increased 35%, three times the growth of the lean period between 1990 and 1996. As a result, employment in the industry has also jumped. From 1996 to 2003, health-care and social-assistance employment increased 20.9%, a pickup from the 8.5% gain during the previous six-year period. Another big source of jobs in 2003 was public administration (Table 1). After falling for seven years, employment in public administration has increased in every year since 2000, including a surge of 37,000 in 2003. However, even with the recent gains, employment in public administration (at 815,000) remains well below its peak in 1993. In 1993, civil servants made up 6.7% of the workforce, compared with 5.2% in 2003. The majority of the 2003 gain in public administration was at the federal level. Ottawa-Gatineau received the lion's share of the new federal employment, helping to dramatically improve the labour market in that area. On average, the unemployment rate was 6.8% in Ottawa-Gatineau, down from 7.2% the year before. Together, public administration and health care and social assistance drove the gain of 90,000 in public-sector employment in 2003. The year before, education and health care were responsible for most of the increase. With consumer spending having risen for the better part of the last seven years, employment in retail and wholesale trade continued to advance. In 2003, trade employment averaged 2.5 million, 31,000 higher than the previous year. Much of the gain resulted from added jobs in food stores. Reduced output at auto plants and continued weakness in high-tech pulled down manufacturingA rapidly rising Canadian dollar, which made Canadian goods more expensive to American customers, combined with reduced auto sales and a continued slump in high-tech, hobbled manufacturing in 2003. Employment in the industry fell 32,000 from the previous year's average level. The weakness was concentrated in computer and electronic as well as transportation equipment. The decline in manufacturing employment had a significant influence on the overall employment trend. In fact, employment outside manufacturing rolled along at 2.9%, a similar pace to the year earlier (Chart E). Shipments from Canadian plants fell through most of 2003, creating widespread losses in manufacturing. Overall, from January to October, shipments were down 0.4% from the same period a year earlier. Driving the trend was a modest decline in transportation equipment (-4.4%). For the first 10 months of 2003, cumulative new motor vehicle sales in Canada were 4.2% below the same period in 2002, a record year when sales climbed 8.5%. The reduced domestic demand for automobiles does not explain all the weakness in automobile and parts manufacturing in Canada, since most products are destined for export. Over the January to October period, automobile and parts exports from Canada were down almost 10% from the same period a year earlier. Declines also continued for shipments of computer and electronic equipment, falling 14.3% in the first 10 months of 2003. The value of computer and electronic equipment shipments was half the 2000 level, when high-tech production was at its peak. Some encouraging signs at the end of the yearHelping offset the negative effects of the rapidly rising Canadian dollar was an amazing spurt of economic growth in the United States at the end of 2003. In the third quarter, U.S. gross domestic product leapt an annualized 8.2%. Other international markets appear to be on track to help Canadian economic growth. The composite leading indicator produced by the Organisation for Economic Co-operation and Development suggests moderate to strong recovery. The index points to continued accelerating performance in the United States and improving performance in Euro currency countries, particularly Germany and France.1 In Canada, the leading index increased significantly in the last quarter of 2003, jumping 0.8% in December. Manufacturing sector affected youth and core-age workersYouth and core-age workers (25 to 54) were affected most by the manufacturing slump. On average, 15,000 fewer youths and 26,000 fewer core-age workers worked in manufacturing in 2003. Nevertheless, all major age-sex groups managed employment gains (Table 2). The largest came from people 55 and older—in part because baby boomers are now entering this age group. The annual average growth rate for this group was 10.7% in 2003, shared by men and women. For older women, the largest component of the increase came from added employment in health care and social assistance. For older men, the gain was in education, construction and real estate. The year 2003 marked the third consecutive year that older workers have led the way in the labour market (Chart F). The median age of retirement in Canada in 2003 was close to 62, up somewhat from the lows of the 1997-1999 period, when it was just under 61. Among core-age workers, women were the main beneficiaries of public-sector hiring. On average, employment in 2003 among core-age women was up 59,000 (1.1%) from the year earlier. Over three-quarters of the gain occurred in health care and social assistance (25,000 or 2.4%) and public administration (19,000 or 6.4%). Employment among core-age men also increased in 2003, largely the result of the construction boom. Overall, employment for core-age men was up 46,000 (0.8%), propelled by a 21,000 gain in construction. While youth employment fell through much of the year, the average level of employment among this group remained high. Youth employment averaged 2.4 million in 2003—40,000 or 1.7% higher than the year before. Employment in retail and wholesale trade was higher for youth than the year earlier. Strongest employment gains in AlbertaEmployment growth has been strong in Alberta for over a decade. In 2003, employment increased a further 48,000 (2.9%) from a year earlier (Chart G), driven by added hiring in the oil patch and in retail and wholesale trade. For the year, the unemployment rate in Alberta was 5.1%, down 0.2 percentage points from the year earlier. All age groups saw employment increases in 2003. Half the increase in natural resource employment was in Alberta. Oil industry employment was 9,000 higher than the year earlier in that province. According to the Canadian Association of Oilwell Drilling Contractors, drilling activity increased significantly in Canada in 2003, with oil and gas explorers completing a record number of wells. In December, the employed share of the working-age population in Alberta hit 70.2%, the highest employment rate on record for any province. In both Calgary and Edmonton, the employment rate was very high. In Calgary, it averaged 71.5%, the highest of any major city in Canada, while in Edmonton, third highest, it hit 68.5%. Employment growth in both Calgary (2.1%) and Edmonton (2.8%) was robust in 2003. Driven by gains in Vancouver, employment also expanded in British Columbia in 2003. The average level in the province was 50,000 (2.5%) higher than in 2002, with Vancouver up 34,000 (3.2%). A number of industries hired in 2003, mostly in the service sector. The unemployment rate in British Columbia was 8.1% in 2003, down from 8.5% the year previous. In Ontario, employment was higher than in 2002. Despite weakness over the summer months in the Toronto area, employment gains at the start and end of the year helped push employment 160,000 (2.6%) higher than the year before. The unemployment rate averaged 7.0% in 2003, down only slightly for the year. Almost all of the decline in manufacturing occurred in Ontario and Quebec. In Ontario, just under 1.1 million people were employed in manufacturing, down 28,000 (-2.5%) from 2002. Motor vehicle equipment, metal production, and computer manufacturing were the main sources of the decline. Following a very strong 2002, employment growth slowed in Quebec. On average, employment was 57,000 higher than in 2002 (1.6%), just under half the increase in 2002 (118,000 or 3.4%). Employment trends changed in the two largest industries in the province-manufacturing and trade. After a gain of 13,000 in 2002, manufacturing employment fell 17,000 in 2003. In trade, following a jump of 36,000 the year earlier, employment increased by only 11,000 in 2003. As in many other provinces, people in Quebec continued to participate in the labour market in record number, even with slower job gains. With labour market participation high, the unemployment rate in Quebec increased to 9.1% in 2003, up half a percentage point. In Prince Edward Island, employment increased 2.5% (1,700), similar to the pace in the preceding two years. On average, in 2003 the unemployment rate was 11.1%, the lowest since 1980. Employment rates have been climbing for six years in the province, hitting a new high of 60.8% in 2003. In Nova Scotia, employment grew at the start of the year, fizzled over the summer, only to rebound at the end of the year. In total, employment was up 7,000 (1.6%) for the year, enough to knock the unemployment rate to 9.3% (down 0.4 percentage points) and push the employment rate to a record high 57.3% (up 0.6 points). Employment increased in Newfoundland and Labrador for the third consecutive year. In 2003, it increased 4,000 (1.8%) compared with the year earlier. Although lower than 10 years ago, unemployment remains stubbornly high in Newfoundland and Labrador. The rate was 16.7%— about the same as the year earlier. A large difference remained between the unemployment situation in St. John's, where the rate was a relatively low 9.6%, and rural Newfoundland and Labrador, where it averaged 21.0%. The other provinces saw no obvious improvement in their employment trends during 2003. While average employment levels in Manitoba and Saskatchewan were higher than the year before, this was only because these provinces held on to gains made during 2002; there was no net job creation during 2003. Despite the lack of job creation during the year, employment rates in both Manitoba and Saskatchewan remained high in 2003. In Manitoba, the share of the working-age population employed averaged 65.5% in 2003—above the national average and close to the record of 65.6% set in that province the year earlier. In Saskatchewan, the employment rate was 64.4%, the highest on record. Unemployment remained low in both provinces in 2003. The only province with lower employment in 2003 was New Brunswick. Following a gain of 3.3% in 2002, employment edged down 0.2%. This was enough to cause the unemployment rate to edge up 0.2 points to 10.6%. Employment levels in accommodation and food fell 4,000, the largest drop of any industry in the province. Notes
Geoff Bowlby is with the Housing, Family and Social Statistics Division. He can be reached at (613) 951-3325 or perspectives@statcan.gc.ca. Full article in PDF You need to use the free Adobe Reader to view PDF documents. To view (open) these files, simply click on the link. To download (save) them, right-click on the link. Note that if you are using Internet Explorer or AOL, PDF documents sometimes do not open properly. See Troubleshooting PDFs. PDF documents may not be accessible by some devices. For more information, visit the Adobe website or contact us for assistance. |
|