 |
|
 |                |

| February 2004 |
|
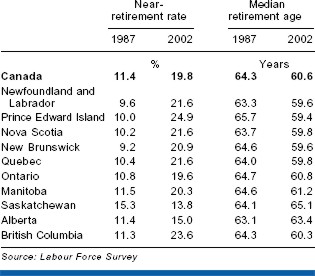
The near-retirement rate Canada's population is aging and baby boomers are fast approaching their retirement years. If labour force participation by age remains around the present rates, more seniors will likely mean a shrinking workforce. In fact, the overall participation rate could fall as low as 57% by 2025, a considerable drop from its current level of 67%.1 In addition, the median retirement age has dropped—from 64 in 1987 to 61 in 2002 (see Defining retirement). These changes will fundamentally affect the workforce. A scarcity of workers may lead to rising wages. This could encourage older workers to stay in the labour force longer or deter younger people from pursuing long-term postsecondary education. Also, employers may institute more automation and strive for greater workplace productivity. Past studies have identified changes in the proportion of older workers in the labour force. While results highlight the demographic effects of an aging population, they provide little information on possible labour supply shortages. The age at which people retire plays an important role in determining the potential effect of an aging population on the workplace. This article identifies trends between 1987 and 2002 in the 'near-retirement rate (NRR)'—the percentage of workers who are within 10 years of the median retirement age. This rate indicates potential employment shortages but does not predict precise numbers of future retirees. It simply identifies the proportion of workers nearing the median retirement age for their industry, occupation or province. An increasing proportion of workers are close to retirementThe NRR is affected primarily by two factors: the median retirement age and the age distribution of a given group. All else held equal, a decrease in the median retirement age will result in an increase in the NRR, since more workers will be within 10 years of this age or older. Likewise, the aging of the population will cause the NRR to rise, given an increased number of older workers relative to the entire working population. A look at the NRR over time reveals both a falling median retirement age and an aging population. The national rate steadily increased during the 15-year period between 1987 and 2002—from 11% to 20%. The largest increase occurred from 1996 to 1997, a period during which early retirement peaked (Kieran 2001). The number of people nearing retirement continued to increase through the late 1990s and into 2002. (Chart A) Median retirement age and near-retirement ratesThe aging population accounted for a relatively small portion of the increase in the NRR until about 1997 when it began to rise. Not surprisingly, this coincides approximately with the year the oldest baby boomers were first included in the group of workers approaching retirement. Assuming the current median retirement age does not increase dramatically, the NRR will rise as more workers from this generation approach the median retirement age. (Table 1) Near-retirement rates are increasing for both men and womenBoth men and women had increases in their NRRs, although the rate for women grew at a much faster pace. In fact, over the 15-year period, the NRR for women increased 12 percentage points to 20.6%, while rising 8 points to 21.2% for men. The likely explanation is that while the median retirement age for women dropped considerably—from 65 to 60—the age for men fell by only two years—to 61 in 2002. The upward trend in the public-sector NRR has had a disproportionate effect on the rate for women. Almost 25% of employed women work in the public sector, compared with only 14% of working men. (Chart B) The public sector leads the upward trend in the near-retirement rateBetween 1987 and 2002, most of the increase in the NRR could be attributed to the public sector, where the median retirement age dropped dramatically over much of the 1990s and into 2002. In 1987, when the median retirement age in the public sector was 63, 13% of the public-sector workforce fell into the near-retirement group. By 2002, one in three workers (33%) was within 10 years of the retirement age (58). (Table 2) In the three largest public-sector industries—public administration, education, and health care and social assistance—NRRs increased considerably between 1987 and 2002. The largest jump came in education, from 15% to 39%. Over the period, the median retirement age fell to 57, the lowest of any industry. While the median retirement age in education is particularly low, workers are somewhat older. In 2002, the average age in education was 42, almost three years more than the average for all industries. (Chart C) After education, the next largest increase was in public administration. In 2002, 32% of the public administration workforce was within 10 years of the median retirement age, an increase of 17 percentage points from 1987. As with education, the retirement age dropped sharply in this industry. In 2002 it was 58, four years lower than in 1987. (Table 3) In health care and social assistance, the other major industry driving the upward trend in the broader public sector, the NRR increased from 9% in 1987 to 25% in 2002. Near-retirement rates and median retirement age by occupationNear-retirement rates by occupation reflected those by industry. The highest NRR in 2002 was for the social science, education, government service and religion group (36%), almost triple its 1987 level. This group had the lowest median retirement age in 2002, down almost five years from 1987. The lowest NRR and highest retirement age were found in art, culture and recreation, where the rate declined slightly over the period as the retirement age increased. (Table 4) Near-retirement rates and median retirement age by provinceIn 2002, most provinces had NRRs of about 20%, roughly double the rates in 1987. The exceptions were Alberta and Saskatchewan, with Saskatchewan claiming the lowest rate in the country at 13.8%, down 1.5 percentage points from 1987. Alberta was second lowest at 15.0%—up only 3.6 percentage points from 15 years earlier. Why is the NRR both low and relatively unchanged in these two provinces? First, their median retirement ages are the highest in the country—63.4 in Alberta and 65.1 in Saskatchewan. Hence, the percentage of their workforces near retirement is less than the national average. But why did the rates not grow as in other parts of the country? One reason is that the median retirement age in these two provinces actually increased between 1987 and 2002. Undoubtedly, this was at least partly because of the rise in the retirement age in agriculture during this time. Prince Edward Island experienced an increase of 15 percentage points in its NRR between 1987 and 2002, with a notable 25% of workers nearing retirement in 2002. British Columbia's rate increased 6 percentage points between 2001 and 2002 (17% to 24%) while their median age of retirement decreased from 62 to 60. Quebec's rate hit a peak of 24% in 1997 and 1998 when the provincial median retirement age fell from 62 in 1996 to 58 in 1998, but then dropped to 19% when the retirement age increased to 60 in 1999. (Table 5)
Notes
References
Full article in PDF For further information, contact Henry Pold, Labour and Household Surveys Analysis Division. He can be reached at (613) 951-4608 or henry.pold@statcan.gc.ca. You need to use the free Adobe Reader to view PDF documents. To view (open) these files, simply click on the link. To download (save) them, right-click on the link. Note that if you are using Internet Explorer or AOL, PDF documents sometimes do not open properly. See Troubleshooting PDFs. PDF documents may not be accessible by some devices. For more information, visit the Adobe website or contact us for assistance. |
||