
Quick fact

Archived Content
Information identified as archived is provided for reference, research or recordkeeping purposes. It is not subject to the Government of Canada Web Standards and has not been altered or updated since it was archived. Please "contact us" to request a format other than those available.
A look at occupational employment
Employment trends are affected by both short-term fluctuations in the business cycle and longer-term changes in factors such as technology and the aging of the population. Some elements of both cyclical and longer-term changes are evident in employment by broad occupational groups.
Among 10 major occupational groups, 2 have continuously added jobs since the mid-1990s: health and trades, transport and equipment operators. By contrast, occupations unique to primary industry and to processing, manufacturing and utilities have posted the largest and most frequent job losses over the period. For example, employment unique to processing, manufacturing and utilities dropped for 4 consecutive years in the early 1990s and 5 consecutive years in the 2000s—from 2004 to 2008.
Chart - Employment change in selected occupations
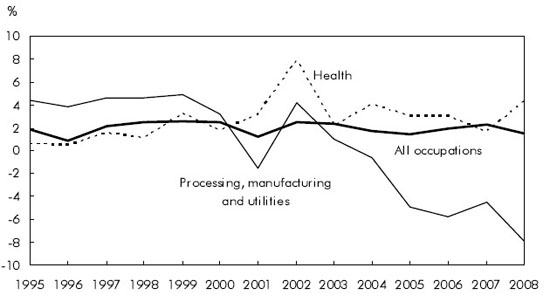
Source: Statistics Canada, Labour Force Survey.
In terms of unemployment, health occupations have been the most resilient, posting the lowest unemployment rate both in 1993 (which was the worst year for the labour market of the 1990s, with overall unemployment at 11.4%) and in 2007 (the best year of the 2000s so far, with overall unemployment at 6.0%). Unemployment in health occupations was 2.6% in 1993 and 1.1% in 2007.
A number of occupations with positive employment trends seem to have two characteristics in common: relatively high education levels and a large concentration of women. Five occupational groups that make up 60% of total employment have a majority of women. They also tend to have high educational requirements. These are occupations in the business, finance and administrative group; health; social science, education, government service and religion; art, culture, recreation and sport; and sales and service. Except for the latter group (which declined a slight 0.4%), the other groups posted job growth of about 4% on average in 2008.
On the other hand, two occupational groups that are male-dominated (unique to primary industry, and to processing, manufacturing and utilities) and generally have lower educational requirements posted job losses of 5.9% and 7.9% respectively.
Well over one-third (35%) of Canadian workers now have postsecondary education, up from 28% in 1993, and just under one-quarter (24%) hold a university degree, up from 17%. While the share of women in the work force increased 2 percentage points to 47% in 2008, their share of university degree holders jumped 7 points, to 50% of the work force with university degrees.
![]() Table - Employment change in selected occupations
Table - Employment change in selected occupations
See also:
- Date modified: