
How many years to retirement?

Archived Content
Information identified as archived is provided for reference, research or recordkeeping purposes. It is not subject to the Government of Canada Web Standards and has not been altered or updated since it was archived. Please "contact us" to request a format other than those available.

by Yves Carrière and Diane Galarneau
- Overview of the study
- Introduction
- Impact of involuntary retirements on expected working life
- Do less-educated workers delay their retirement longer?
- Shorter post-retirement life expectancy for less-educated workers
- Accounting for a reduced work schedule
- Conclusion
- Related material for this article
Start of text box
Note from the Editor
Insights on Canadian Society is a new publication from Statistics Canada. Its goal is to provide analytical studies to policy makers, analysts and the general public on topics of interest that are relevant to Canadians. We hope you enjoy our new product and that you share your feedback with us at ics@statcan.gc.ca.
End of text box
Start of text box
Overview of the study
In 2009, a 50-year-old worker could expect to continue working for an average of 16 more years, which means retiring at the age of 66. In the late 1990s, expected working life at age 50 was 13 years. Workers have therefore increasingly been delaying their retirement. These findings from a previous study are analyzed at greater length in this article, as are the unexpected personal and economic factors that push some workers to retire early. When such 'involuntary' retirements are taken into account, are workers still more likely to retire later than in the late 1990s?
- When workers pushed into retirement for personal or economic reasons are taken into account, the expected working life for a 50-year-old worker is 14.5 years, compared with 16.3 years when only 'voluntary' retirements are considered.
- Even when the factors that push workers to retire are considered, the delay in retirement is clear: compared with the end of the 1990s, men age 50 in 2009 retired 2.1 years later and women age 50 retired 2.6 years later.
- The increase in expected working life is similar for all workers, regardless of education level. However, since less-educated workers have a shorter life expectancy, they are expected to spend 3 fewer years in retirement than their more-educated counterparts.
End of text box
Introduction
Keeping older workers on the job and delaying retirement have, in recent years, been considered to reduce the economic and financial pressures brought about by the aging population. Encouraging workers to stay at work would favour, for example, knowledge transfer, pension plan sustainability, and a longer period for workers to save for retirement.Note 1
However, the timing of retirement is determined by a complex process that involves a combination of personal aspirations and circumstances, financial preparation and certain institutional factors. A number of indicators suggest that changes are already under way. Older Canadians are now more educated, in better healthNote 2 and living longer, so many of them have begun delaying their retirement. Conversely, some may also have to do so for financial reasons. In any event, a recent article showed that an employed Canadian who was 50 years of age in 2008 could expect to continue working for another 16 years before retiring, compared with 13 years in 1997.Note 3
Those findings were based on retirements reported by Labour Force Survey (LFS) respondents. But when certain events, such as a layoff, illness, disability, or having to care for a loved one, occur late in a person's career, they could push workers out of the labour force altogether and into 'involuntary' retirement.
In this article, involuntary retirements are taken into account to provide a more complete picture of retirement behaviour. This is important because if involuntary retirements make up a significant part of all retirements, they could challenge efforts meant to keep older workers on the job.
This paper also examines differences by education level. Educational attainment is an important factor in the decision whether to retire since it is often associated with a certain degree of skill and certain types of jobs. It is also closely linked to income and wealth. Do less-educated workers delay their retirement more than more-educated workers?
Lastly, since the number of hours worked by people 50 and over has declined since the 1990s, this article attempts to determine whether this delay in retirement remains when hours worked are factored into expected working-life calculations.Note 4
Impact of involuntary retirements on expected working life
How can the number of years left before retiring be predicted for a 50-year-old worker? This can be done with a method inspired by the concept of life expectancy, which is interpreted the same way. In other words, instead of using an estimate of the number of years left to live, this method calculates expected working life at age 50—that is, the number of years someone that age can expect to stay employed before retiring.Note 5 Expected working life is calculated using employment exits reported as retirements by Labour Force Survey (LFS) respondents.
It is possible, however, that some older workers exited the labour force because they were laid off, sick or had a disability, or had to care for a family member. Certain hypotheses can be applied to identify, based on the LFS, which job exits are involuntary retirements.Note 6 These can be added to voluntary retirements to get a broader definition of retirements. It was determined that involuntary retirements make up about one-quarter of total retirements, a proportion similar to results seen in other studies.Note 7
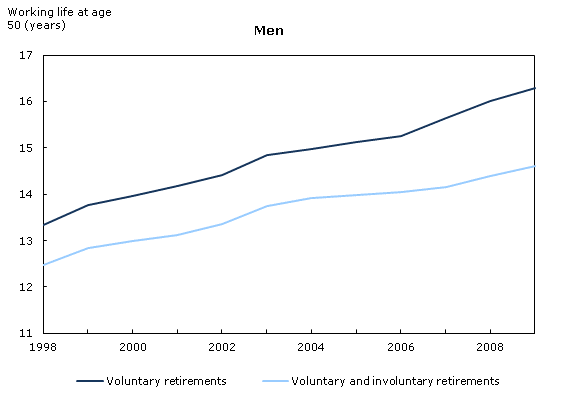
Combining involuntary employment exits and voluntary retirements reduces expected working life. When only voluntary retirements were taken into account, expected working life in 2009 was 16.3 years for men and 16.1 years for women (Chart 1). However, when involuntary factors were also considered, expected working life was shorter—14.6 years for men and 14.2 years for women.Note 8 Involuntary retirements thus advance retirement, especially when they occur for economic reasons, as these factors account for about 60% of the decrease due to involuntary retirements.
Chart 1
Involuntary retirements reduced expected working life by nearly 2 years in 2009
Description for chart 1a - Men
Description for chart 1b - Women
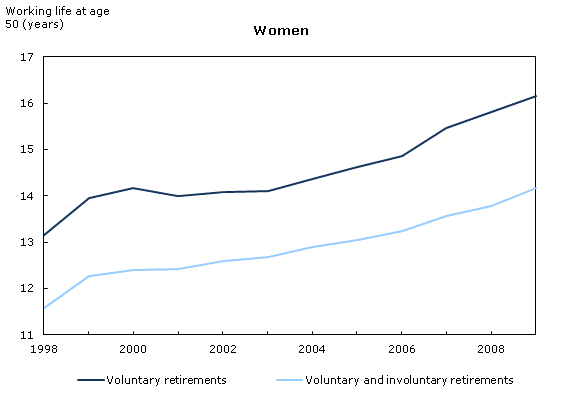
Source: Statistics Canada, Expected working-life tables based on Labour Force Survey data, 1997 to 2010.
Nevertheless, even when involuntary retirements are taken into account, the delay in retirement remains: from 1998 to 2009, expected working life increased from 12.5 to 14.6 years for men and from 11.6 to 14.2 years for women. In short, the delay in retirement declined from an estimated 3 years when only voluntary retirements were considered to 2.1 years for men and 2.6 years for women when involuntary retirements were also taken into account.
Do less-educated workers delay their retirement longer?
A number of factors suggest that the above-mentioned trends might vary by education level. On one hand, higher educational attainment might encourage a further delay in retirement, because, on average, more-educated workers are in better health, have less physically demanding jobs and are in industries where schedules and working conditions are more flexible. On the other hand, more-educated workers often have higher employment earnings and are more likely to have a pension plan, which could actually prompt them to retire earlier.
Less-educated workers might be more likely to take involuntary retirement because they are in poor health or were laid off. Because of their lower educational attainment and, in some cases, a lesser degree of versatility, such workers are more likely than more-educated workers to have a prolonged job-search period.Note 9 Hence, taking involuntary retirements into account could accentuate differences by education level.
However, differences in expected working life between various education levels are relatively small. In 2009, expected working life at age 50 (taking all retirements into account, whether voluntary or involuntary) was 14.3 years for workers with less than a high school diploma, compared with 14.6 years for workers with a postsecondary education (Chart 2). That said, workers at every education level are now more likely to delay their retirement since expected working life was about 12 years for all workers in 1998, regardless of educational attainment.
Chart 2
Expected working life similar for all education levels, 1998 and 2009
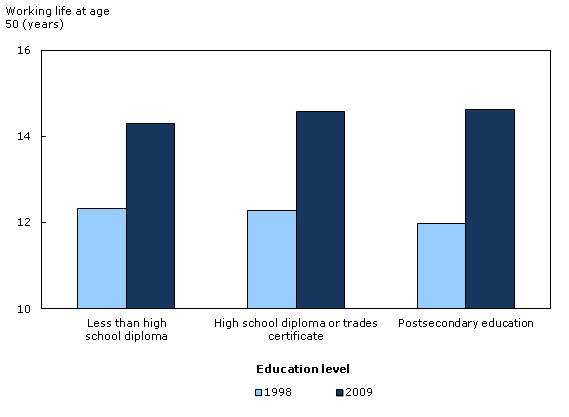
Sources: Statistics Canada, Expected working-life tables based on Labour Force Survey data, 1997 to 2010; Estimated probabilities of death by education level based on data from the 1991 to 2006 censuses; Wilkins et al. 2008.
Shorter post-retirement life expectancy for less-educated workers
Since the late 1990s, expected working life has increased, but because life expectancy has also increased, post-retirement life expectancy has remained relatively stable. But what happens when involuntary retirements are taken into account? Since involuntary factors effectively advance retirement, how many years do these factors add to post-retirement life expectancy?
When only voluntary retirements are considered, a 50-year-old worker in 2009 could expect to live 17.3 years after retirement. Taking involuntary retirements into account increases post-retirement life expectancy to 19.2 years. In other words, involuntary retirements add nearly 2 years to post-retirement life expectancy (Chart 3).
Yet there are significant differences in post-retirement life expectancy by education level. Because less-educated workers have a shorter life expectancyNote 10 and an expected working life comparable to their more-educated counterparts, they also have the shortest post-retirement life expectancy.
Less-educated workers have a post-retirement life expectancy of 18 years, compared with 20 and 21 years for their more-educated counterparts. In other words, less-educated workers should expect to live about 3 years less after retirement than their more-educated counterparts. However, the gap between those with the most education and those with the least education has narrowed since the late 1990s, with expected working life increasing slightly faster for more-educated workers.
Chart 3
Less-educated workers can expect to live shorter lives and spend fewer years in retirement than more-educated workers, 2009
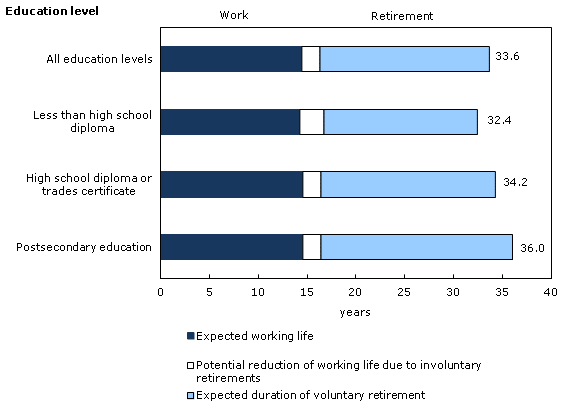
Sources: Statistics Canada, Expected working-life tables based on Labour Force Survey data, 1997 to 2010; Estimated probabilities of death by education level based on data from the 1991 to 2006 censuses; Wilkins et al. 2008.
Accounting for a reduced work schedule
The above results indicate that the number of years before retirement increased by 2.1 person-years for men and by 2.6 person-years for women, which does not necessarily represent a gain in years of full-time work. Do these results change when working hours are taken into account? This is an important question as the number of hours worked has been declining among older workers since the 1990s, and gains in years of employment may not have translated into as large an increase in hours.
To answer this question, expected working life can be expressed as 'full-time equivalents' (FTEs). In this article, 1 full-time equivalent is 1 work week of about 40 hours.Note 11
For all workers combined and each education level, expected working life in FTE years was less than expected working life in person-years (Table 1). This result is not surprising because people age 50 and over work a little less than 40 hours per week. In 2009, the expected working life of workers at all education levels was 14.5 person-years, compared with 12.9 FTE years.
| Person-years | Full-time equivalents | Difference | |
|---|---|---|---|
| years | % | ||
| All education levels | |||
| 1998 | 12.1 | 11.2 | 7.4 |
| 2009 | 14.5 | 12.9 | 10.6 |
| Increase (%) | 19.2 | 15.0 | Note ...: not applicable |
| Less than high school diploma | |||
| 1998 | 12.3 | 11.7 | 4.8 |
| 2009 | 14.3 | 13.3 | 6.7 |
| Increase (%) | 16.0 | 13.6 | Note ...: not applicable |
| High school diploma or trades certificate | |||
| 1998 | 12.3 | 11.3 | 7.7 |
| 2009 | 14.6 | 13.1 | 9.9 |
| Increase (%) | 18.7 | 15.9 | Note ...: not applicable |
| Postsecondary education | |||
| 1998 | 12.0 | 10.9 | 9.2 |
| 2009 | 14.6 | 12.8 | 12.6 |
| Increase (%) | 22.2 | 17.5 | Note ...: not applicable |
| ... not applicable Sources: Statistics Canada, Expected working-life tables based on Labour Force Survey data, 1997 to 2010; Estimated probabilities of death by education level based on data from the 1991 to 2006 censuses; Wilkins et al. 2008. |
|||
Whether expected working life is expressed in person-years or FTEs, the delay in retirement is clear. Between 1998 and 2009, for all education levels combined, expected working life increased by 2.4 persons-years (19%) and by 1.7 FTEs (15%). In addition, as was the case in person-years, the increase since 1998 was more pronounced among more-educated workers.
Conclusion
The concept of expected working life can be used to provide an indication of the number of working years left before a 50-year-old worker retires. A recent article showed that retirement has been pushed back by 3 years since the late 1990s. However, that estimate was based only on retirements reported in the LFS and did not take certain events into account (like illness or layoff) that might push workers to retire involuntarily. When involuntary retirements are included, workers age 50 are still more likely to postpone their retirement than their counterparts in the 1990s, regardless of their education level. However, since the less-educated have a shorter life expectancy, they are also more likely to have a shorter retirement.
Since labour force growth is expected to slow down,Note 12 older workers' retirement delay could dampen the potential impact of population aging on the Canadian economy. Nevertheless, the results show that involuntary retirements can affect the timing of retirement. Because such retirements usually take place at a younger age, being pushed into retirement could mean less income, a lower standard of living and higher costs for income-support programs. Finally, these results could continue to change as more and more workers are starting their careers later in life. Other data sources currently in development, like data from the Longitudinal and International Study of Adults, will enable analysis of these issues in greater detail in the future.
Yves Carrière was an analyst with Human Resources and Skills Development Canada while he was writing this article. Diane Galarneau is an analyst with the Labour Statistics Division, Statistics Canada.
Notes
- See Burniaux et al. 2004; Expert Panel on Older Workers 2008; Denton and Spencer 2009; Mintz 2009; Hering and Klassen 2010; Hicks 2011.
- See Ramage-Morin et al. 2010.
- See Carrière and Galarneau 2011.
- See Data sources, methods and definitions.
- The article refers to 'expected working life' even though not all years are necessarily spent in employment. Some workers could experience job interruptions, unemployment spells or time out of the labour force. These events cannot be included in the LFS.
- See Selection criteria for involuntary retirements.
- See Chan and Stevens 2002; Neil and Schirle 2009; Finnie and Gray 2011.
- Retirements for health reasons account for most of the rest, since potential retirements due to personal and family responsibilities have a marginal effect on expected working life for both men and women. However, retirements associated with personal and family responsibilities may increase as the population ages.
- See Dubé 2004.
- For example, in 2009 the estimated life expectancy at age 50 was 32.4 years for people with less than a high school diploma, 34.2 years for those with a high school diploma or trades certificate, and 36.0 years for those with a postsecondary education.
- In this paper, usual hours of work were used because they fluctuate less. If actual hours of work (which averaged 36.2 in 2009 for the population age 15 and over) had been used, the number of full-time equivalents would have been higher, but the trends would have been the same.
- See Martel et al. 2011.
Additional information
Data sources
Bibliographic references
- Date modified: