Analysis

Archived Content
Information identified as archived is provided for reference, research or recordkeeping purposes. It is not subject to the Government of Canada Web Standards and has not been altered or updated since it was archived. Please "contact us" to request a format other than those available.
Introduction
After-tax income remained stable through the recession
After-tax income was also stable across quintiles
Slowdown in absolute after-tax income mobility
Relative income mobility has increased in recent years
Market income declined for families in 2009
Government transfers rose with higher Employment Insurance benefits received
Median income taxes lower in 2009
Nationally, little change in low income
Provincially, few changes in low income
Comparing changes in selected countries
Crossing the low-income lines
References
Introduction
Update: Estimates of after-tax absolute income mobility were revised in June 2012 and are now expressed in 2009 constant dollars instead of current dollars. Table 2 and the text were modified to reflect this change.
This report examines the incomes of families and unattached individuals, as well as low income and income mobility in Canada in 2009. It is based on information provided by the participants in the Survey of Labour and Income Dynamics. Because a large portion of the participants have provided information for several years, a closer look at how income changes over time is possible.
The data prior to 1993 are drawn from the Survey of Consumer Finances (SCF). From 1998 onward, the data are taken from the Survey of Labour and Income Dynamics (SLID). For the 1993-to-1997 period, estimates are based on a combined sample from SCF and SLID.
This report analyses family income on the basis of medians. The median is the point at which half of all families had higher income and half had lower. All figures in this report are sample survey estimates, unless otherwise stated. All income estimates are expressed in constant 2009 dollars to factor in inflation and enable comparisons across time in real terms. 1
In 2009, the global economic crisis had far-reaching impacts on the economies of the world. From the third quarter of 2008 to the second quarter of 2009, real gross domestic product (GDP) in Canada fell by 3.6%. While the recession was less severe and shorter in Canada than the other G7 nations (Cross, 2009), nonetheless, its effects were observed in some aspects of the income of Canadians.
After-tax income remained stable through the recession
Median after-tax income2 for Canadian families of two or more persons was $63,800 in 2009, virtually unchanged from 2008 (Chart 1). This was the second consecutive year without significant change in after-tax income, after four years of growth.
Non-senior families, those whose major income earner was less than 65, had a median after-tax income of $68,100 in 2009. However, the amount varied by family type. For example, two-parent families with children received $75,600, while female lone-parent families had a median income of $37,400. Senior families had a median after-tax income of $46,800.
At $25,500, the after-tax income of unattached individuals remained stable from 2008 to 2009, though this was not the case for all unattached individuals – seniors saw a 4.5% increase in their median income to $23,300.
Chart 1
Median after-tax income, by family type, 2008 and 2009

In most provinces, families of two persons or more saw year-to-year stability in after-tax income; Saskatchewan and New Brunswick were the exceptions. In Saskatchewan, median after-tax income of families of two persons or more rose 7.5% from 2008 to 2009; in New Brunswick, 3.2%. In both provinces, only non-senior families saw gains.
As in previous years, noticeable differences are apparent in median after-tax income of families among the provinces and among selected census metropolitan areas (CMAs)(Figure 1). Among the provinces, median after-tax income was significantly higher in Ontario and westward than in Quebec and Atlantic Canada. Since 2004, Alberta has had the highest median after-tax income for economic families with two persons or more—$77,800 in 2009.
At the CMA level, families living in Regina, Calgary, Edmonton, Hamilton and Victoria all reported higher median after-tax income than the national median of $63,800.3
After-tax income was also stable across quintiles
Analysis can be done at a finer level by breaking down the population of individuals into five equal-sized groups, or quintiles, from lowest after-tax income to highest after-tax income.4 The average after-tax income did not change significantly in any quintile from 2008 to 2009 (Table 1). This is the first time since 2003 that none of the quintiles showed an increase. In contrast, in 2006 and 2007, all five quintiles posted increases in average income.
| 2005 | 2006 | 2007 | 2008 | 2009 | |
|---|---|---|---|---|---|
| Lowest quintile | 14,100 | 14,800* | 15,500* | 15,500 | 15,400 |
| Second quintile | 25,400* | 25,800* | 27,000* | 27,300 | 27,200 |
| Third quintile | 34,700* | 35,300* | 36,500* | 37,300* | 37,500 |
| Fourth quintile | 46,100 * | 46,900* | 48,300* | 49,400* | 49,600 |
| Highest quintile | 76,600 | 78,800* | 81,700* | 83,800 | 83,500 |
| * denotes significant change from the previous year | |||||
Slowdown in absolute after-tax income mobility
While the previous sections examined and compared annual income statistics, it is also of interest to look at the dynamics of individuals' income. The SLID makes analysis of absolute and relative mobility possible by looking at those individuals who participated in the survey for several years.
Absolute after-tax income mobility measures the changes in an individual's after-tax income between two periods.5 It tells us how many people enjoyed an advance in income and how many people experienced a setback over time.6
Between 2008 and 2009, more people experienced an increase in income than a decrease: 58% of the individuals saw their income increase (Table 2). In comparison, the proportion of individuals who saw their income increase was 62 % for the 2006-2007 period, prior to the recession, and 54% for the 1996-1997 period.
From 2008 to 2009, the average after-tax income remained virtually unchanged, while for the 2006-to-2007 period, individual's average after-tax income increased by 3.7%.
To understand this difference, it helps to look at the magnitude of the increase and decline in income in the two time periods. The average increase among the gainers in the 2008-to-2009 period was 19%, an increase equivalent to that of the 2006-2007 and 1996-1997 periods. The average decrease from 2008 to 2009 among those whose income was unchanged or declined was 21%, slightly more than the 18% average decline in 2006–2007 and 1996-1997.
| Period | Change in average after-tax income | Proportion of people whose after-tax income dropped* | Average drop in their after-tax income | Proportion of people whose after-tax income rose | Average rise in their after-tax income |
|---|---|---|---|---|---|
| % | |||||
| 1996-1997 | 1.6 | 46 | 18 | 54 | 20 |
| 2006-2007 | 3.7 | 38 | 18 | 62 | 19 |
| 2008-2009 | 0.2 | 42 | 21 | 58 | 19 |
| * This includes those whose income remained the same between 2008 and 2009. | |||||
Relative income mobility has increased in recent years
While absolute mobility refers to the change in income of the same person over time, individuals' relative income mobility depends on both changes in their own incomes and those of others. Relative income mobility measures the movements of an individual's rank, as measured by quintile, between two periods.7 Hence, it provides a more complete picture of change in income for the population over time.
Compared to absolute mobility, relative mobility in recent years has increased. Previous studies have shown that income mobility in Canada was moderate when compared to other developed countries, owing to, for example, the stabilizing effect of government transfers.8 But the SLID data indicated that Canadians' relative income mobility has increased.
A substantial number of Canadians have changed income quintiles in recent years. From 2008 to 2009, an average of 35% of Canadians moved from one income quintile to another (Table 3). In contrast, from 1996 to1997, 34% of Canadians changed income positions. If we look at the data over five years, a much larger number of people showed a change in their quintile. Between 2005 and 2009, 53% of Canadians switched income quintiles, while between 1993 and 1997, 51% of Canadians switched.
During the periods analysed, more Canadians moved up than down the income ladder. In 2009, 19% of Canadians moved up to a higher quintile relative to their position one year earlier; 16% moved down. Between 2005 and 2009, 28% of Canadians moved up and 25% moved down. Indeed, further investigation showed that the upward movement in the income of Canadians was often more than the downward movement during all of the one- and five-year periods from 1993.
Forthcoming studies will attempt to explain the relationship between mobility and the economic cycle while taking into account household composition, changes in Canadian demography and other factors.
| Proportion of persons who moved into a higher quintile |
Proportion of persons who moved into a lower quintile |
Total mobility |
Proportion of persons who moved into a higher quintile |
Proportion of persons who moved into a lower quintile |
Total mobility |
|
|---|---|---|---|---|---|---|
| (%) | ||||||
| One-year | 2008-2009 | 1996-1997 | ||||
|
Lowest quintile
|
25 | 0 | 25 | 27 | 0 | 27 |
|
Second quintile
|
26 | 14 | 40 | 22 | 17 | 39 |
|
Third quintile
|
24 | 20 | 44 | 23 | 20 | 43 |
|
Fourth quintile
|
19 | 23 | 42 | 16 | 23 | 39 |
|
Highest quintile
|
0 | 24 | 24 | 0 | 22 | 22 |
|
Overall average
|
19 | 16 | 35 | 18 | 16 | 34 |
| Five-year | 2005-2009 | 1993-1997 | ||||
|
Lowest quintile
|
43 | 0 | 43 | 41 | 0 | 41 |
|
Second quintile
|
41 | 20 | 61 | 38 | 20 | 58 |
|
Third quintile
|
34 | 29 | 63 | 33 | 27 | 60 |
|
Fourth quintile
|
24 | 38 | 62 | 25 | 34 | 59 |
|
Highest quintile
|
0 | 40 | 40 | 0 | 39 | 39 |
|
Overall average
|
28 | 25 | 53 | 27 | 24 | 51 |
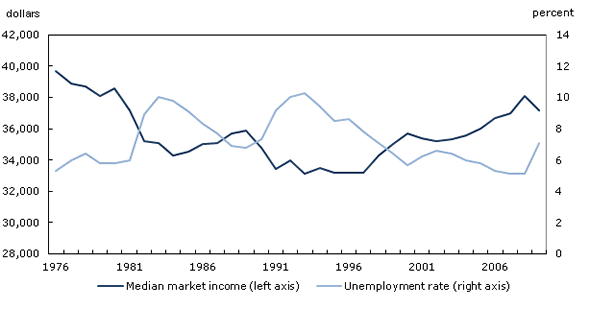
Market income declined for families in 2009
As noted earlier, median after-tax income was relatively stable across the country between 2008 and 2009, however some of its underlying components showed movement. Because these components moved in opposite directions, in most cases no apparent change in after-tax income was observed in 2009.
Market income, comprising earnings, private pensions, income from investments, and other sources, is closely linked to labour market conditions. Families with two persons or more saw their median market income decrease 3.2% from 2008 to 2009 to $63,000 . This marks the first significant drop in the median since the early nineties.
To better understand the drop in family market income, working-age individuals (aged 25 to 54) were looked at separately. For those individuals who received market income, the median amount dropped 2.4% to $37,200 in 2009. Particularly for this population, market income is related to the unemployment rate (Chart 2). The annual unemployment rate for the population aged 25 to 54 rose by 2.0 percentage points to 7.1% from 2008 to 2009; roughly equal to the 1.9% percentage point increase during 1990–1991, but lower than the 2.9 percentage point increase of the 1981-1982 recession. The 2.4% decrease in market income was less in 2009 than during those two previous economic downturns.
Chart 2
Median market income of recipients and the unemployment rate, persons aged 25 to 54, 1976 to 2009
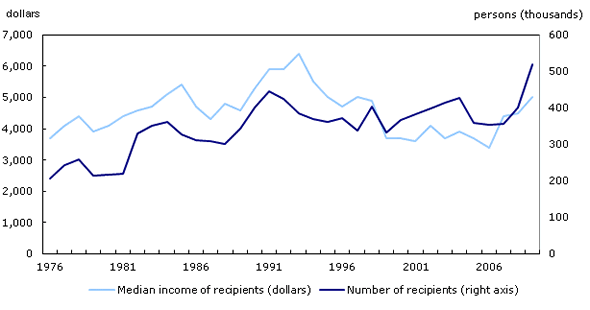
Government transfers rose with higher Employment Insurance benefits received
Government transfers are programs such as Employment Insurance, the Canada Pension Plan and Quebec Pension Plan, Old Age Security, Guaranteed Income Supplement, Social Assistance, and Canada Child Tax Benefit.
Transfers received by different family types vary widely. For non-senior families, the median government transfers rose $700 to $3,600 in 2009; for senior families, it went up $500 to $24,700.
Among the unattached, those under 65 saw a $100 increase in median transfers to $500; unattached seniors saw an increase of $300 to $15,800.
Eighty-six percent of Canadian families and 79% of unattached individuals received some form of government transfer in 2009. The total amount of government transfers to families and unattached rose 10% in 2009.
More than half of the increase in transfers between 2008 and 2009 were in the Employment Insurance benefits received. The number of families and unattached who received EI benefits increased by 20% and 29% respectively (Chart 3 and Chart 4). Of families who received EI benefits, the median benefits increased by 22% to $6,100.
Chart 3
Number of families who received EI and median benefits, 1976 to 2009
Chart 4
Number of unattached who received EI and median benefits, 1976 to 2009
For the other components of government transfers, families who received child benefits saw a $200 increase in the median, up to $2,600 in 2009. As well, working income tax benefits increased to $800 per recipient as a result of enhancements to the program. For families, GST credits, provincial tax credits, social assistance, and workers compensation remained stable.
Median income taxes lower in 2009
Among families of two persons or more, the median income tax paid was lower than in 2008 (Chart 5). The median amount of income taxes paid by non-senior families dropped $900 from 2008 to $9,400 in 2009. Senior families paid $1,900 in 2009, $600 less than in 2008.
A number of elements combined for these conditions. The economic downturn meant lower market income for Canadian families. Also, new tax credits were introduced in 2009, including the home renovation tax credit and first-time home buyers' tax credit.
Lone-parent families, who typically pay little in income taxes, and unattached individuals experienced stability with respect to the amount of taxes paid. Lone-parent families paid a median $400 in 2009, while unattached individuals paid $2,300.
Chart 5
Median income tax paid by family type, 1976 to 2009
Non-senior families in Alberta paid $13,100 in 2009, 9.0% less than in 2008; in British Columbia, $8,200 in 2009, down 8.9% from 2008; in Ontario, $9,600 in 2009, down 10.3% from 2008, and in Quebec, $8,500, down 7.6% from 2008.
Senior families in Ontario paid less in income taxes in 2009 as they paid a median of $2,900, down $700 from 2008.
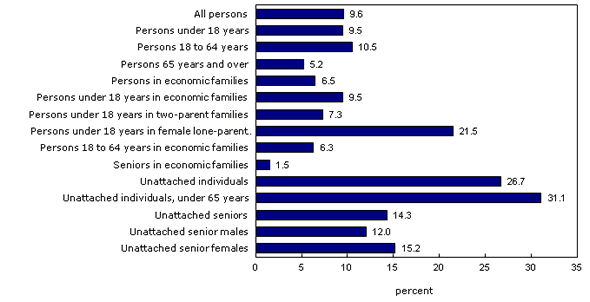
Nationally, little change in low income
For a more complete picture of low income,9 Statistics Canada uses two low-income indices—incidence and gap ratio10—and three complementary low income lines:11 Statistics Canada's Low Income Cut-off (LICO) and Low Income Measure (LIM) as well as the Market Basket Measure (MBM) developed by Human Resources and Skills Development Canada (HRSDC). While each looks at low income from a different angle, they give a generally consistent picture of low income over time. No one measure is best; each has its own strengths and weaknesses in the study of low income (Zhang, 2010). To better understand low income, one should examine all lines in parallel.12
The LICOs have a long history in Canada. They were first published using 1959 Survey of Family Expenditures data, and were rebased in 1992. They represent an income threshold below which a family would likely devote a larger share of its income to necessities (food, clothing, and shelter) than an average family would.
According to the after-tax LICO, or LICO-AT, almost 3.2 million Canadians lived in low income in 2009, virtually unchanged from 2008. This accounts for 9.6 % of the population13 (Chart 6). Additionally, the average gap ratio was 34% in 2009, unchanged from 2008 and little changed since the late 1990s.
About 634,000 children younger than 18 lived in low-income families in 2009, unchanged from 2008 but fewer than in the early 2000s. This equates to 9.5% of all children, roughly half the 1996 peak of 18%.
In 2009, 196,000 children in low income lived in female lone-parent families, 31% of all children in low income. Twenty-two percent of children living in female lone-parent families were living in low income in 2009, unchanged from 2008 but lower than the most recent peak of 56% in 1996.
The incidence of low income for children living in two-parent families was 7.3% in 2009, virtually unchanged from 2008.14
Among seniors living in families, the incidence has remained low—for most of the past 20 years, it has been below 3%. In 2009, 1.5% of seniors in families were below the LICO-AT. For those in low income, the average gap ratio was 38%.
About 1.3 million unattached individuals (27%) had income below the LICO-AT in 2009, virtually unchanged from 2008.15 On average, low income unattached individuals had after-tax income 39% below their low income cut-off.
Among unattached persons under 65, 31% lived in low income in 2009, twice that of unattached seniors (14%). Unattached persons under 65 in low income had, on average, after-tax income 43% lower than their low income cut-off (15% for unattached seniors).
Chart 6
Incidence of low income using the LICO-AT, 2009
Provincially, few changes in low income
Another perspective on low income is the Market Basket Measure (MBM), developed by Human Resources and Skill Development Canada (HRSDC). It is an estimate of the cost of a specific basket of goods and services (food, shelter, clothing, footwear, transportation, and other expenses) representing a modest, basic standard of living.16 It is defined for a reference family of one male and one female adult aged 25 to 49 with two children (a girl aged 9 and a boy aged 13) in 49 geographical areas within the 10 provinces. The cost of this basket is then compared with the disposable income17 of families to determine if they were in low income. Because it is constructed using costs at the sub-provincial level, it provides a measure more sensitive to regional differences in living costs than the LICO and the LIM. However, changes in the incidence or average gap ratio of low income using the MBM concept are affected not only by changes in income, but also by price changes for the items within the basket, which may differ between regions.
In almost all provinces, the incidence of low income and the average gap ratio was stable from 2008 to 2009. Manitoba, Saskatchewan and Alberta were the exceptions.
In Manitoba, 9.7% of persons lived in low income in 2009 as defined by the MBM, compared with 7.8% in 2008 (Chart 8). While the incidence increased, low income Manitobans had a MBM-disposable income 27% lower than their MBM threshold, down from 35% in 2008.
On average, the MBM-disposable income for persons living in low income in Saskatchewan was 38% lower than their MBM thresholds, up from 32% in 2008.18
In Alberta, almost 10% of persons lived in low income as defined by the MBM in 2009, compared with 6% in 2008.19
While incidences for many provinces showed no statistically significant changes from 2008 to 2009, the 2009 provincial incidences were, in many cases, lower than at the start of the millennium. Additionally, comparing 2000 to 2009, few provinces showed change in the average gap ratio.
In Newfoundland and Labrador, 13% of persons lived in low income in 2009, as defined by the MBM,20 compared with 21% in 2000 (Chart 7). Similarly, Prince Edward Island posted a decline21 in the incidence of low income, from 15% in 2000 to 8.8% in 2009. In New Brunswick, 11% of persons lived in low income in 2009, down22 from 14% in 2000. In Quebec, the incidence in 2009 was 9.5%, lower23 than the 12% at the beginning of the millennium.
In Nova Scotia, the incidence of low income was unchanged at 13% in 200924 from 10 years prior (Chart 7).
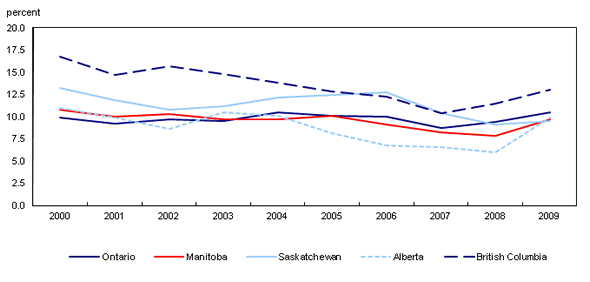
In Ontario, the incidence of low income measured by the MBM was 11% in 2009, the same as in 2000 (Chart 8).25
In Saskatchewan, the incidence of low income, measured using the MBM, was lower at the end of the decade, 9.5%, than at the beginning, 13.2%.26 This was also the case in British Columbia, where in 2009, 13% of persons lived in low income, compared with 17% in 2000.27
Chart 7
Incidence of low income using the MBM, all persons, selected provinces, 2000 to 2009
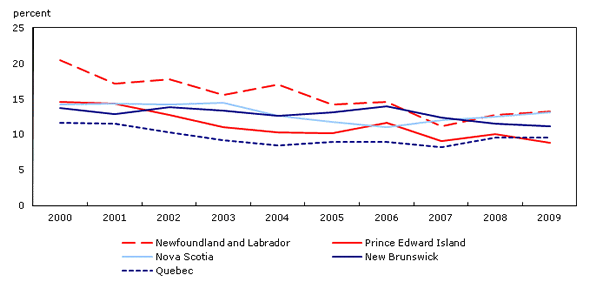
Chart 8
Incidence of low income using the MBM, all persons, selected provinces, 2000 to 2009
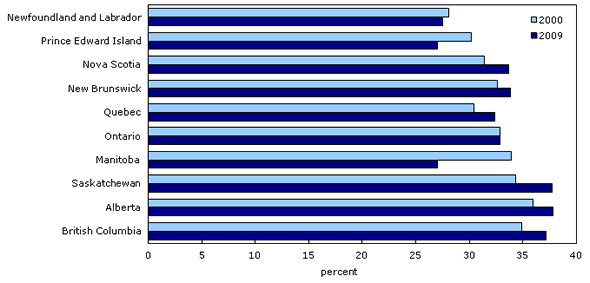
Despite some decreases in the incidence of low income as defined by the MBM, the average gap ratio in almost all provinces remained stable when comparing 2000 to 2009, with Manitoba the only exception (Chart 9). While the proportion of Manitobans living in low income remained stable when comparing 2000 and 2009, on average, those in low income had MBM-disposable income 27% lower than their MBM threshold, less than the 34% in 2000.28
Chart 9
Average gap ratio using the MBM, all persons, by province, 2000 and 2009
Comparing changes in selected countries
Yet another way of looking at low income is the distribution of income. This can be done using the Low Income Measure (LIM), defined as a fixed percentage, 50%, of the median income of all individuals. Each individual's income is represented by their 'adjusted' household income. The adjustment is made to reflect the fact that household needs increase based on their size.
One advantage of the LIM is that it can be used to make international comparisons, since there are no embedded prices or expenditure assumptions—it is based strictly on the distribution of income.29
Because some conceptual differences30 remain between countries, this section will report on the change in the incidence of low income and average gap ratio rather than levels.
Chart 10
Change in incidence of low income and average gap ratio, selected countries, 2008-2009
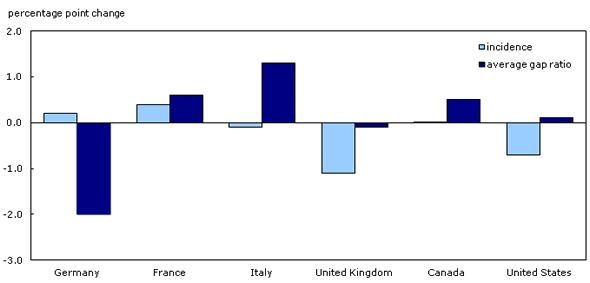
In the G7 countries (excluding Japan), from 2008 to 2009 the incidence of low income declined in the United Kingdom and the United States and increased slightly in France.31 In Germany, Italy and Canada, there was little or no change in the proportion of persons living in low income (Chart 6).
The average gap ratio declined in Germany by 2.0 percentage points and increased in Italy by 1.3 percentage points from 2008 to 2009. No change was observed in other countries.
Crossing the low-income lines
Family income can change from one year to the next, for many reasons. Family members may change their labour market involvement: they may start or end a job, or change the number of hours they work. They may get a promotion or lose their job. Additionally, changes to the composition of the family, such as a birth, death or separation, may change the resources available or the number of persons sharing the resources. A family may move to a larger city, which may affect the threshold that their income is compared with. For these and other reasons, individuals may move into or out of low income.
Chart 11
Transitions of persons into and out of low income from 2007 to 2008, based on LICO-AT
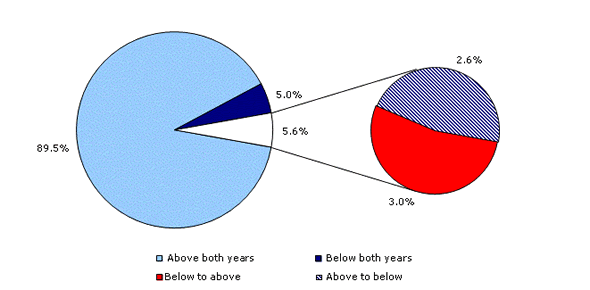
Chart 12
Transitions of persons into and out of low income between 2008 and 2009, based on LICO-AT
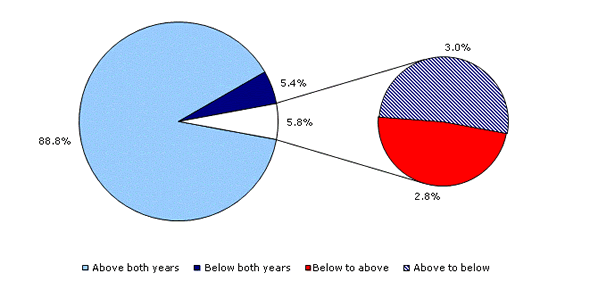
SLID's longitudinal nature enables the examination of changes to income over time. Analysis using the LICO-AT showed that, from 2008 to 2009 and from 2007 to 2008, the turnover in the low-income population was balanced—almost the same proportion moved into low income as moved out, about 3% (Chart 11 and Chart 12). This is in line with the stability in the incidence of low income between those pairs of years. Analysis using the LIM showed similar proportions moving in and out of low income in both periods. When examining these movements using the MBM, from 2008 to 2009, 3.0% moved out of low income while 3.9% moved into low income.
References
Bureau of Labour Statistics. Current Population Survey Database. www.bls.census.gov/ferretftp.htm
Chen, Wen-Hao: (2009): "Cross-national Differences in Income Mobility: Evidence from Canada, the United States, Great Britain and Germany," Review of Income and Wealth, Series 55, Number 1.
Cross, Philip (2009). "Year-end review of 2009." Canadian Economic Observer,11-010-X. Vol. 23. No. 4.
Duchesne, Doreen. 2004. "More Seniors at Work." Perspectives on Labour and Income. Vol. 5 no. 2. Spring. Statistics Canada Catalogue no. 75-001-XIE /pub/75-001-x/10204/6789-eng.pdf
Fields, Gary: (2006): "The Many Facets of Economic Mobility". ILR School Articles & Chapter, Paper 230, Cornell University, Ithaca, NY.
Hatfield, Michael, Wendy Pyper and Burton Gustajtis. 2010 "First Comprehensive Review of the Market Basket Measure of Low Income". Applied Research Branch paper. Human Resources and Skills Development Canada. Summer. Paper version: ISBN: 978-1-100-16063-4, Cat. No.: HS28-178/2010E. PDF version: ISBN: 978-1-100-16064-1, Cat.No.: HS28-178/2010E-PDF. Departmental catalogue number: SP-953-06-10E. Copy available on request by contacting: MBM-MPC@hrsdc-rhdcc.gc.ca.
Organisation for Economic Co-operation and Development. 2008. "Growing Unequal? Income Distribution and Poverty in OECD Countries". http://www.oecd.org/document/53/0,3343,en_2649_33933_41460917_1_1_1_1,00.html
Statistics Canada. 2011. "Low Income Lines, 2009–2010". Income Research Paper Series. 75F0002MIE /bsolc/olc-cel/olc-cel?catno=75F0002M&chropg=1&lang=eng
Turcotte, Martin and Grant Schellenberg. 2007. A Portrait of Seniors in Canada 2006. Statistics Canada Catalogue no. 89-519-XIE. Ottawa. 301pp. /pub/89-519-x/89-519-x2006001-eng.pdf (p. 67).
Walsh, Mark. 1999. "Working Past Age 65." Perspectives on Labour and Income. Vol. 11 no. 2 Summer. Statistics Canada Catalogue no. 75-001-XIE /studies-etudes/75-001/archive/e-pdf/4601-eng.pdf
Zhang, Xuelin. 2010. "Low Income Measurement in Canada: What Do Different Lines and Indexes Tell Us?" Statistics Canada. Income Research Paper Series 75F0002MIE /pub/75f0002m/75f0002m2010003-eng.htm
Eurostat. "Data explorer" Table Database. http://epp.eurostat.ec.europa.eu/portal/page/portal/statistics/search_database. Tables ilc_li02 and ilc_li11. (accessed April 2011)
Bureau of Labour Statistics. Current Population Survey Database. www.bls.census.gov/ferretftp.htm (microdata runs completed May 2010).
Notes:
1. Throughout Income in Canada, differences between estimates are reported where statistically significant at the 95% confidence interval.
2. After-tax income is calculated as follows: market income (earnings, investments, private pensions, other income) plus government transfers less income taxes. After-tax income is used through much of this analysis since it reflects income redistribution through transfers and taxes.
3. Only CMAs with a population of at least 175,000 persons and a survey sample of at least 300 economic families are included in this analysis.
4. This section examines income at the person level, where individuals are represented by their adjusted after-tax household income. This adjustment yields indicators that reflect after-tax income defined on a per-person basis. The adjusted income is calculated by dividing the household income by the square root of the household size. This adjustment takes into account the economies of scale present in larger households. It also enables the combining of families and unattached individuals for analysis.
5. The mobility is examined at the person level, where individuals are represented by their adjusted after-tax household income in 2009 constant dollar (see note 4).
6. The absolute mobility is measured as follows: an increase in income is when the income of the second year is higher than the income of the first year; a setback is defined by an income smaller or equal to the income of the first year. Notice that on very few occasions the income is exactly equal both years.
7. The relative mobility is estimated in three steps. First, the population is divided into five groups (quintiles) according to their first year adjusted household after-tax income. Second, it is estimated how many people moved up, how many people moved down and how many stayed in the same quintiles over the second period. This results in a transition matrix. Finally, the elements of the transition matrix are examined. The average of the off-diagonal elements provides a measure of mobility of income. Researchers have proposed several complex mobility indexes, but there is no consensus among them on the interpretations of these indexes (Fields, 2006).
8. See Chen (2009).
9. Low-income statistics are reported at the individual level, where individuals are represented by their family income (for the LICO and the MBM) or household income (for the LIMs). In this way, the statistics are not distorted by variations in the size of families in the various groups of interest. For example, instead of talking about the incidence of low income in lone-parent families, we talk about the incidence of low income among individuals who live in lone-parent families.
10. For individuals in low income, the gap ratio is the difference between their family income (for the LICO and the MBM) or household income (for the LIM) and their low-income threshold, expressed as a percentage of that threshold. For example, if a family had an income of $20,000 and their threshold was $25,000, their gap ratio would be (25,000-20,000)/25,000 or 20%.
11. See Statistics Canada (2011) for a detailed description of how these lines are defined.
12. The approach used in this analysis is as follows: For the national picture, the primary threshold utilized is the LICO-AT. When examining the provincial picture, the primary threshold utilized is the MBM. In these two sections, results using the primary threshold are reported in the text, with changes over time mentioned if they are statistically significant. If the change in the indices are also significant using other thresholds, this is reported in footnotes. For the international section the LIM-AT is the only threshold available across the countries and is the only one for which results are mentioned.
13. Using the MBM and disposable income, the incidence increased to 10.6% in 2009 (9.5% in 2008).
14. Using the MBM and disposable income, the incidence increased to 8.8% in 2009 (7.1% in 2008).
15. Using the MBM and disposable income, there was a small increase in the number of unattached in low income (up 113,000 persons) and a corresponding increase in the incidence (to 25% in 2009).
16. The MBM underwent a comprehensive review of the thresholds in 2009 and 2010. This review resulted in a rebased set of thresholds for 49 regions across the 10 provinces. Hatfield, Pyper and Gustajtis (2010) provide a complete review of the decisions and a discussion of the impact on the incidence of low income and average gap ratio from 2000 to 2007. Some changes were made to the entire time series, but some were made only to parts of the period. Of particular note, the introduction of a new National Nutritious Food Basket was phased in over 2008 and 2009, leading to larger increases in the thresholds over this period compared with other years.
17. Disposable income is defined as the amount remaining after deducting the following from total family income: total income taxes paid; the personal portion of payroll taxes; other mandatory payroll deductions, such as contributions to employer-sponsored pension plans, supplementary health plans, and union dues; child support and alimony payments made to another family; out-of-pocket spending on child care; and non-insured but medically prescribed health-related expenses such as dental and vision care, prescription drugs, and aids for persons with disabilities.
18. Using the LICO-AT, it was 37% (31% in 2008) and using the LIM, it was 28% (34% in 2008).
19. An increase was also seen when looking at low income based on the LICO-AT (7.7% in 2009, up from 5.6% in 2008) and the LIM (9.1% in 2009, up from 7.0% in 2008).
20 All low income lines show declines in the incidence of low income—using the LICO-AT, the incidence fell to 7% in 2009 from 13% in 2000; using the LIM, the incidence decreased to 16% in 2009 from 21% in 2000.
21. There was also a decline using LICO-AT to 4.8% from 9.1% in 2000.
22. There was also a decline using LICO-AT to 6.7% from 9.2% in 2000.
23. There was also a decline using LICO-AT to 9.4% from 14.8% in 2000.
24. There was a decline using LICO-AT to 8.0% from 11.6% in 2000.
25. Using the LIM, the incidence was 13% in 2009 and 10% in 2000. This is the only case (province and low-income line) where the incidence was higher in 2009 than 2000.
26. Similar declines were seen using the LICO-AT and the LIM.
27. A similar decline was seen using the LICO-AT.
28. A similar decrease was seen using the LIM to 26% in 2009 from 33% at the start of the millennium.
29. The OECD produced a report on the low income situation across the world (OECD, 2008).
30. Differences include the definition of income and the equivalence scale used. For example, in the European countries, inter-household transfers and imputed rent are included in income; they are not included in income in Canada or the United States.
31. Throughout Income in Canada, 'change' refers to differences that are statistically significant. In this section, where international comparisons are made, Canada is the only country where it can be determined if differences are statistically significant using bootstrap weights. For all other countries, changes cannot be tested for significance, so all changes are mentioned.
- Date modified: