
Statistics Canada
www.statcan.gc.ca
Common menu bar links
Chart D.5.9 Distribution of numeracy proficiency levels, by Aboriginal (urban) and non-Aboriginal (urban and rural) populations aged 16 and over in Manitoba and Saskatchewan, 2003

Archived Content
Information identified as archived is provided for reference, research or recordkeeping purposes. It is not subject to the Government of Canada Web Standards and has not been altered or updated since it was archived. Please "contact us" to request a format other than those available.
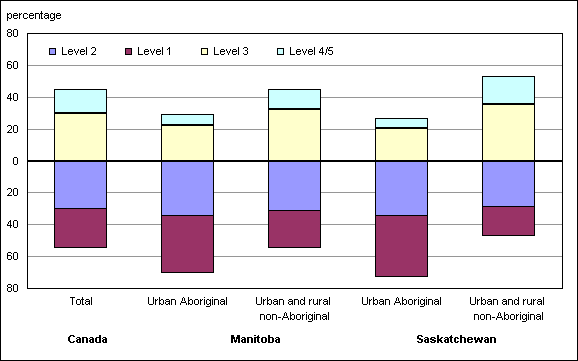
Notes: This chart contains certain estimates with relatively high coefficients of variation. Please see Table D.5.11 for more details. PCEIP 2007 presented an overview of the literacy domains in Table D.5.1 (prose proficiency, document proficiency, numeracy, and problem-solving), then focused on prose proficiency in the remaining tables and charts (Tables D.5.2 through D.5.7; Charts D.5.1 through D.5.5). In these PCEIP June 2008 updates, the D5 series is continued and focuses on numeracy.
Data source: Table D.5.11
Chart source: Statistics Canada and Council of Ministers of Education. 2007. Education indicators in Canada: Report of the Pan-Canadian Education Indicators Program. Catalogue no. 81-582-XIE. Ottawa.
Updated June 16, 2008.