
National Apprenticeship Survey: Canada Overview Report 2015
Section 6 Labour market outcomes and job satisfaction

Archived Content
Information identified as archived is provided for reference, research or recordkeeping purposes. It is not subject to the Government of Canada Web Standards and has not been altered or updated since it was archived. Please "contact us" to request a format other than those available.
The success of apprenticeship programs is determined in large part by whether apprentices secure gainful employment in their trades. The 2015 NAS contains data on labour market outcomes for both apprentices who completed their programs and apprentices who discontinued. It also includes information on whether trades were eligible for Red Seal endorsements or not. This section highlights the following information about apprentices:
- employment status in 2015,
- hourly wages and annual earnings,
- employment related to the apprentice’s trade,
- occupation and industry sector,
- job benefits, and
- job satisfaction levels.
Most of the results reported in this section are limited to NAS apprentices who worked at a job or business during the week prior to the survey interview.Note 1
Key findings
- A higher percentage of completers than discontinuers were
- employed (83.2% versus 76.8%),
- paid employees with permanent jobs (80.8% versus 77.0%),
- paid higher average annual earnings ($69,512 versus $59,782 among paid employees),
- working in a job related to their trades (88.5% versus 38.7%),
- working for the same employers as they did for their apprenticeship programs (53.2% versus 25.4%), and
- working in a job that provided job benefits (90.2% versus 86.4%).
- In the Red Seal trades, apprentices in the automotive service technician and industrial electrician trades had the highest rates of paid employees with permanent jobs.
- Most apprentices who completed an apprenticeship program in the top 10 Red Seal trades were employed in trades occupations during the week prior to the survey.
- Construction and manufacturing were the most common industries among employed completers in the top 10 Red Seal trades.
- Most apprentices were satisfied with their pay, their job security, and their health and safety conditions.
Employment status in 2015
Most apprentices who completed or discontinued their apprenticeship programs between 2011 and 2013 had worked at a job or business in the week prior to the survey interviewNote 2 (Table A.6.1, Appendix A). Overall, 80.5 % of apprentices had worked in the week prior to the time of the survey (the reference periodNote 3). Of those who had worked, most (95.8%) worked full-time (this being defined as 30 or more hours per week). Completers were more likely than discontinuers to have been employed during the reference period (83.2% and 76.8%, respectively) and to work full-time (97.4% and 93.5%, respectively).
The majority of apprentices who were employed in the week prior to the survey interview worked as paid employees with a permanent job (79.3%), while about 1 in 10 (10.9%) were self-employed. Close to 10% were working in temporary or seasonal jobs. Chart 6.1 below presents the employment status of completers and discontinuers. Completers were more likely than discontinuers to be paid employees in permanent jobs (80.8% versus 77.0%), while discontinuers were more likely to be self-employed (12.3% versus 10.0%).
The detailed employment status of completers in the top 10 Red Seal trades is presented in Table A.6.2 (Appendix A). Most completers across these trades—at least three-quarters in each trade—had worked in a job or business during the reference period. The lowest proportions were found in the welder (74.7%) and hairstylist (77.4%) trades; the highest proportions were observed in the automotive service technician (91.7%) and industrial electrician (89.2%) trades.
Among completers in a Red Seal trade who had a job during the reference period, the majority were paid employees with a permanent job. Most industrial electrician (95.9%) apprentices worked in this type of employment. Similarly, most completers in the automotive service technician trade (93.4%) were paid employees with a permanent job, while an additional 5.1% were self-employed. Across the top 10 Red Seal trades, several trades had a much higher proportion of self-employed apprentices. Hairstylist (21.8 %), carpenter (19.2 %), welder (17.6 %), plumber (16.0 %), and steamfitter / pipefitter (13.7%) completers were more highly concentrated in self-employment.
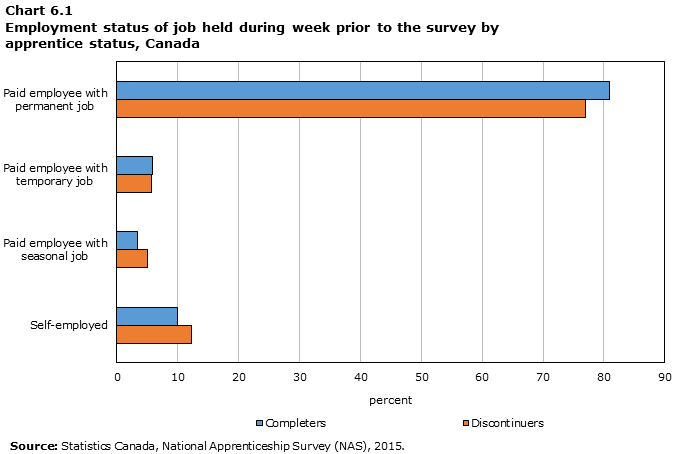
Data table for Chart 6.1
| Discontinuers | Completers | |
|---|---|---|
| percent | ||
| Self-employed | 12.3 | 10.0 |
| Paid employee with seasonal job | 5.0 | 3.4 |
| Paid employee with temporary job | 5.7 | 5.8 |
| Paid employee with permanent job | 77.0 | 80.8 |
| Source: Statistics Canada, National Apprenticeship Survey (NAS), 2015. | ||
Hourly wages and annual earnings
Table A.6.3 (Appendix A) presents the mean and median hourly wages and annual earnings for the jobs held by apprentices (as paid employees) during the reference period (2015).Note 4 Completers had a higher average hourly wage than discontinuers ($33.30 and $27.88, respectively). This is also true of average annual earnings: completers earned $69,512 on average while discontinuers had mean annual earnings of $59,782.
The distribution of grouped hourly wages by apprentice status is presented in Chart 6.2 below (see detailed results in Table A.6.4, Appendix A). The results show that completers were more highly represented than discontinuers in the higher wage categories. About 43% of completers (42.7%) had an hourly wage of $35.00 or higher compared with 22.3% of discontinuers. Nine percent of completers and about 6% of discontinuers had an hourly wage of $50.00 or higher.
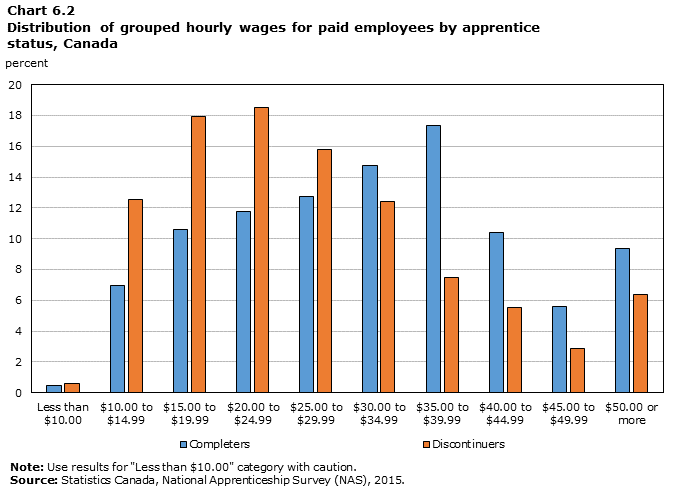
Data table for Chart 6.2
| Completers | Discontinuers | |
|---|---|---|
| percent | ||
| Less than $10.00 | 0.5 | 0.6 |
| $10.00 to $14.99 | 7.0 | 12.5 |
| $15.00 to $19.99 | 10.6 | 17.9 |
| $20.00 to $24.99 | 11.8 | 18.5 |
| $25.00 to $29.99 | 12.7 | 15.8 |
| $30.00 to $34.99 | 14.7 | 12.4 |
| $35.00 to $39.99 | 17.3 | 7.5 |
| $40.00 to $44.99 | 10.4 | 5.6 |
| $45.00 to $49.99 | 5.6 | 2.8 |
| $50.00 or more | 9.4 | 6.4 |
|
Note: Use results for "Less than $10.00" category with caution. Source: Statistics Canada, National Apprenticeship Survey (NAS), 2015. |
||
Apprentices also reported the number of employers they had had since completing or discontinuing their apprenticeship programs (detailed results presented in Table A.6.5, Appendix A). Completers were more likely than discontinuers to have had only one employer (74.3% and 64.4%, respectively). Over 1 in 10 discontinuers had worked with 4 or more employers since discontinuing their apprenticeships (5.1% had worked with 4 employers; 7.2% had had 5 or more).
Employment in 2015 related to apprentices’ trades
An important aspect of the employment of an apprentice is whether or not the job he or she holds following an apprenticeship is related to one’s trade. A detailed analysis was undertaken, therefore, to examine whether an apprentice’s job in the week prior to the survey was in the same occupational group as his or her training program.Note 5 These results are presented by apprentice status in Table A.6.7 (Appendix A) and for the top 10 Red Seal trades in Table A.6.8 (Appendix A). The majority of completers (56.7%) worked in jobs classified in the same occupational groups as their apprentice training programs’ trade and were much more likely to be in that situation than discontinuers (17.7%).
The distribution of completers, whose jobs in the week prior to the survey were in the same occupational groups as the trade related to their apprenticeship program, is presented for the top 10 Red Seal trades in Chart 6.3 below (detailed results are presented in Table A.6.8, Appendix A). Among these trades, more than two thirds of completers in the hairstylist (77.3%), automotive service technician (70.5%), industrial mechanic (72.6%) and plumber (68.2%) trades, had worked in jobs with the same occupations as their apprentice training programs’ trade during the week prior to the survey. The industrial electrician (40.9%) and cook (37.5%) trades had the lowest proportion of completers with a match between an occupation, in the week prior to the survey, and an apprenticeship program trade.Note 6
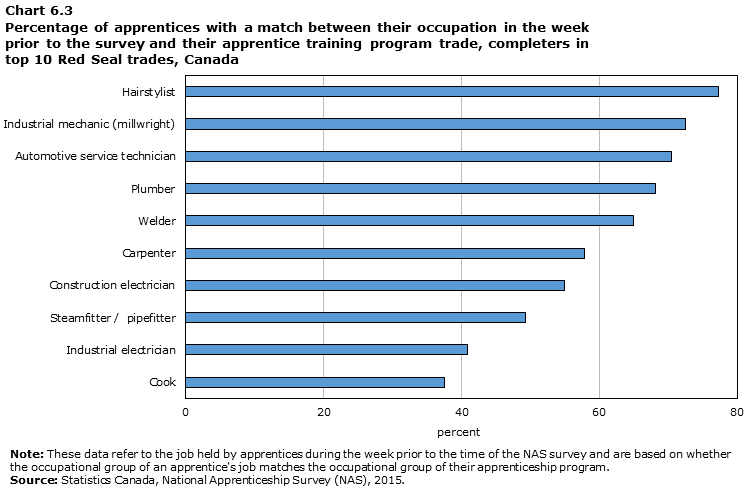
Data table for Chart 6.3
| Percent | |
|---|---|
| Cook | 37.5 |
| Industrial electrician | 40.9 |
| Steamfitter / pipefitter | 49.3 |
| Construction electrician | 55.0 |
| Carpenter | 57.9 |
| Welder | 64.9 |
| Plumber | 68.2 |
| Automotive service technician | 70.5 |
| Industrial mechanic (millwright) | 72.6 |
| Hairstylist | 77.3 |
|
Note: These data refer to the job held by apprentices during the week prior to the time of the NAS survey and are based on whether the occupational group of an apprentice's job matches the occupational group of their apprenticeship program. Source: Statistics Canada, National Apprenticeship Survey (NAS), 2015. |
|
Although some jobs may not be classified in the exact same occupational groups as the apprenticeship program trade, it is still be possible that the jobs belong to related groups. To address this, the 2015 NAS also asked apprentices some questions about whether they considered their jobs in the week prior to the survey related to their trades.Note 7 Table A.6.5 (Appendix A) reports detailed results for these questions. More than two-thirds of apprentices (68.4%) answered that a job they held in the week prior to the survey interview was related to a trade for which they trained. This number is driven primarily by completers, the vast majority of whom (88.5%) held jobs related to their trades in the week prior to the NAS interview. In comparison, 38.7% of discontinuers reported working in a job related to their trades. Of those apprentices who reported that a job they held the week prior to the survey interviews were not related to their trades, most completers (72.1%) reported that they had held a related job at some point; however, only 17.7% of discontinuers of this group had ever had a job related to their trades.
Information about whether apprentices who completed an apprenticeship program reported holding jobs related to their trades is also presented for the top 10 Red Seal trades in Table A.6.6 (Appendix A) and Chart 6.4 below. Generally, a larger proportion of completers in the top 10 Red Seal trades said that the jobs held in the week prior to the survey interviews were related to their trades than was the case among completers in the overall NAS population (88.5%). Completers in the cook and hairstylist trades were the exceptions, as lower percentages of these completers reported holding a job related to their trades during the reference period (84.9% and 79.8%, respectively). It is interesting to note that when using occupational groups to establish an occupation-apprentice program trade match measure, hairstylists have the highest proportion who are working in their trade across the top 10 Red Seal trades (see Chart 6.3). However, when asking apprentices if their job is related to their trade, even though the proportion associated to the hairstylist trade is similar, it now corresponds to the lowest proportion across the top 10 Red Seal trades (see Chart 6.4). This indicates that hairstylist apprentices either work in their trade or in a completely unrelated occupation. Apprentices who completed an apprenticeship training program in the steamfitter / pipefitter, plumber, and industrial mechanic trades showed the highest proportions of those reporting that their job during the reference period was related to their trade, with over 95% for each case.
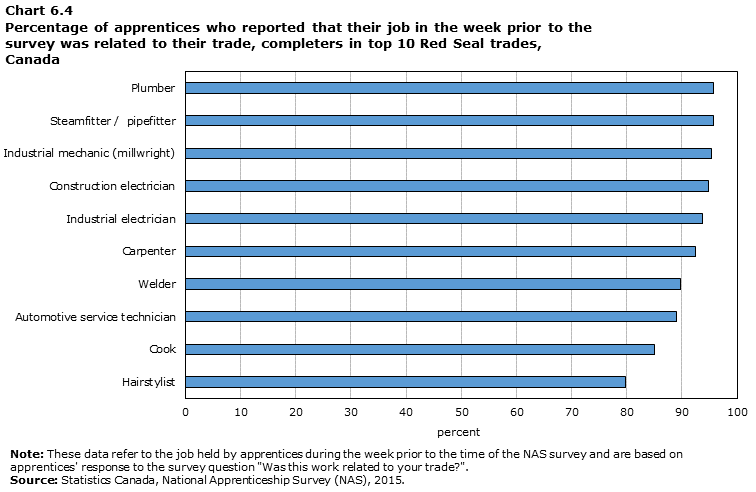
Data table for Chart 6.4
| Percent | |
|---|---|
| Hairstylist | 79.8 |
| Cook | 84.9 |
| Automotive service technician | 89.0 |
| Welder | 89.8 |
| Carpenter | 92.5 |
| Industrial electrician | 93.7 |
| Construction electrician | 94.8 |
| Industrial mechanic (millwright) | 95.4 |
| Steamfitter / pipefitter | 95.7 |
| Plumber | 95.8 |
|
Note: These data refer to the job held by apprentices during the week prior to the time of the NAS survey and are based on apprentices' response to the survey question "Was this work related to your trade?". Source: Statistics Canada, National Apprenticeship Survey (NAS), 2015. |
|
The 2015 NAS also asked apprentices who held a job in the week prior to the survey and were not self-employed, whether their employers during the reference period were the same ones they had during their apprenticeship training (Table A.6.5, Appendix A). Over half of completers (53.2%) had done their apprenticeships with their current employers, while one-quarter (25.4%) of discontinuers worked for the same employers with which they did their apprenticeship training.
Among completers in the top 10 Red Seal trades, industrial electrician apprentices (66.3%) were the most likely to have done their apprenticeships with their employers in the week prior to the survey (Table A.6.6, Appendix A). At the opposite end, completers in the cook trade were the least likely (30.8%) to be working for their apprenticeship employers.
Occupation and industry sector
While apprentices acquire skills and knowledge specific to their trades during an apprenticeship program, Canada’s labour market is such that they may end up working in other occupations or industries. Where apprentices end up can provide some indication of how apprenticeship systems and the skilled trades labour market are performing. The occupational groups and industry sectors in which completers in the top 10 Red Seal trades worked in the week prior to their survey interviews are presented in Table A.6.8 and Table A.6.9 respectively (Appendix A).Note 8
The occupational groups associated with the top 10 Red Seal trades are sales and service occupations and trades, transport / equipment operator or related occupations (based on the 2011 National Occupational Classification). The results show that completers in these apprenticeship training programs were primarily employed in these two occupational groups during the week prior to the survey (Table A.6.8, Appendix A).Note 9 Completers in the hairstylist (86.2%) and cook trades (81.1%) mainly worked in sales and service occupations while apprentices in most other Red Seal trades worked in trades, transport / equipment operator or related occupations.
While these two occupational groups accounted for most completers in the top 10 Red Seal trades, there were other notable groups among these trades. For example, 17.3% of completers in the industrial electrician trade and 4.3% of construction electrician completers were working in natural and applied sciences occupations. Over 1 in 10 completers in the carpenter trade and 5.6% of completers in the cook trade worked in management occupations. Moreover, 5.0% of cook apprentices who completed a program worked in trades, transport / equipment operator and related occupations.
Completers in the top 10 Red Seal trades were also highly concentrated in a few industry sectors.Note 10 The majority of carpenter (89.4%), plumber (88.8%), construction electrician (75.7%), and steamfitter / pipefitter (72.4%) completers worked in the construction industry (Table A.6.9, Appendix A). More than 1 in 5 completers in the welder trade also worked in this industry, and more than half worked in either manufacturing (26.6%) or other services, excluding public administration (30.0%). Completers in the industrial mechanic and industrial electrician trades were concentrated in manufacturing (46.9% and 56.8%, respectively) and in mining and quarrying and oil and gas extraction (17.5% and 12.4%, respectively) industries. Additionally, more than 1 in 10 completers in the industrial mechanic trade (10.7%) worked in the construction sector while 8.0% of completers in the industrial electrician trade worked in the utilities sector.
Most completers in the cook trade (70.6%) worked in the accommodation and food services industry and 81.0% of hairstylist completers worked in other service industries (excluding public administration). Completers in the automotive service technician trade worked in a number of different sectors including retail trade (45.6%), other service industries, excluding public administration (33.0%), construction (4.9%) and wholesale trade (4.8%).
Job benefits
Information about the job benefits of apprentices’ employment during the reference period was also collected in the 2015 NAS (Table A.6.10, Appendix A). Apprentices who were paid employees in the week prior to the survey interview were asked about the types of benefits provided by an employer. The vast majority of paid workers (88.7%) stated that they had one or more types of benefits in their jobs.
The most common benefits that paid workers reported were paid vacation leave (77.4%), extended healthcare benefits (74.9%), and a dental plan (72.6%) (Table A.6.10, Appendix A). More than half (59.1%) also had retirement plan benefits, while just under half received sick leave benefits (49.1%). Completers were more likely to have benefits than discontinuers (90.2% and 86.4%, respectively).
However, discontinuers were somewhat more likely to have sick leave benefits than completers (52.0% and 47.2%, respectively). Slightly more than one-quarter of all apprentices (26.5%) reported having had other benefits not included in the list.
Job satisfaction levels
In addition to answering questions on the employment characteristics of their jobs, apprentices who worked as paid employees were asked to rate their satisfaction with various aspects of their jobs.Note 11 Specifically, completers and discontinuers were asked to report their level of satisfaction with their pay, job security, and health and safety conditions at work. Detailed results are presented by apprentice status in Table A.6.11 (Appendix A) and in Chart 6.5 below.
The majority of paid employees were either satisfied (61.1%) or very satisfied (26.9%) with their pay. Completers were slightly more likely than discontinuers to be very satisfied with the money they made (28.6% and 24.4%, respectively). Most apprentices were also satisfied with their job security. Nearly half (49.3%) reported being satisfied with their job security and an additional 40.0% were very satisfied. Furthermore, most apprentices reported that they were either satisfied (46.2%) or very satisfied (48.3%) with the health and safety conditions at work. Completers and discontinuers rated their satisfaction with job security and health and safety conditions similarly.
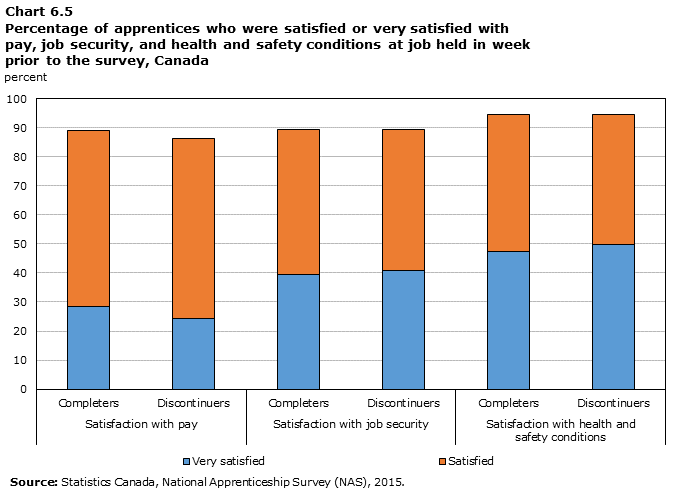
Data table for Chart 6.5
| Satisfaction with pay | Satisfaction with job security | Satisfaction with health and safety conditions |
||||
|---|---|---|---|---|---|---|
| Completers | Discontinuers | Completers | Discontinuers | Completers | Discontinuers | |
| percent | ||||||
| Very satisfied | 28.6 | 24.4 | 39.4 | 40.9 | 47.4 | 49.8 |
| Satisfied | 60.6 | 62.0 | 49.8 | 48.4 | 47.2 | 44.8 |
| Source: Statistics Canada, National Apprenticeship Survey (NAS), 2015. | ||||||
Notes
- Date modified: