
Statistics Canada
www.statcan.gc.ca
Common menu bar links
Chart 4
Percentage distribution of change in work status over a two-year period, by sex and marital status, household population aged 20 to 64 and married at baseline, 1994/1995 to 2004/2005, Canada excluding territories

Archived Content
Information identified as archived is provided for reference, research or recordkeeping purposes. It is not subject to the Government of Canada Web Standards and has not been altered or updated since it was archived. Please "contact us" to request a format other than those available.
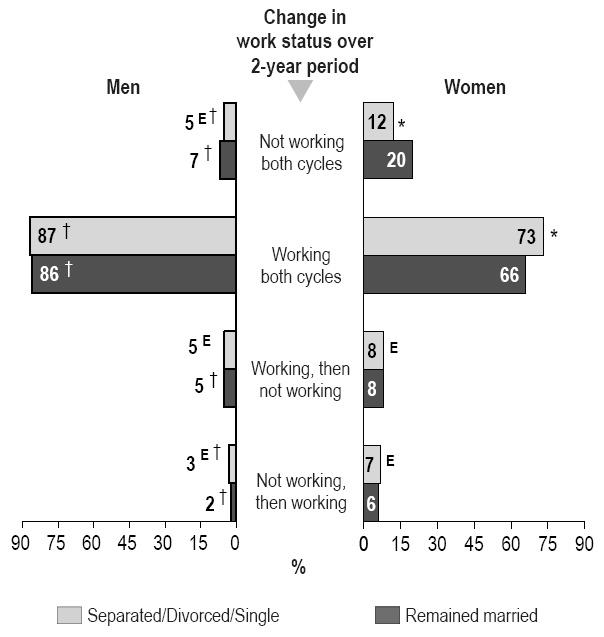
* Significantly different from estimate for those who remained married (p < 0.05).
† Significantly different from corresponding category for women (p < 0.05).
E use with caution (coefficient of variation 16.6% to 33.3%).
Source: 1994/1995 to 2004/2005 National Population Health Survey, longitudinal file (square).