
Figure 3
Model-adjusted percentage with positive self-perceived general and mental health, by labour force participation and strength
of family network, Métis women aged 45 to 64, Canada, 2012
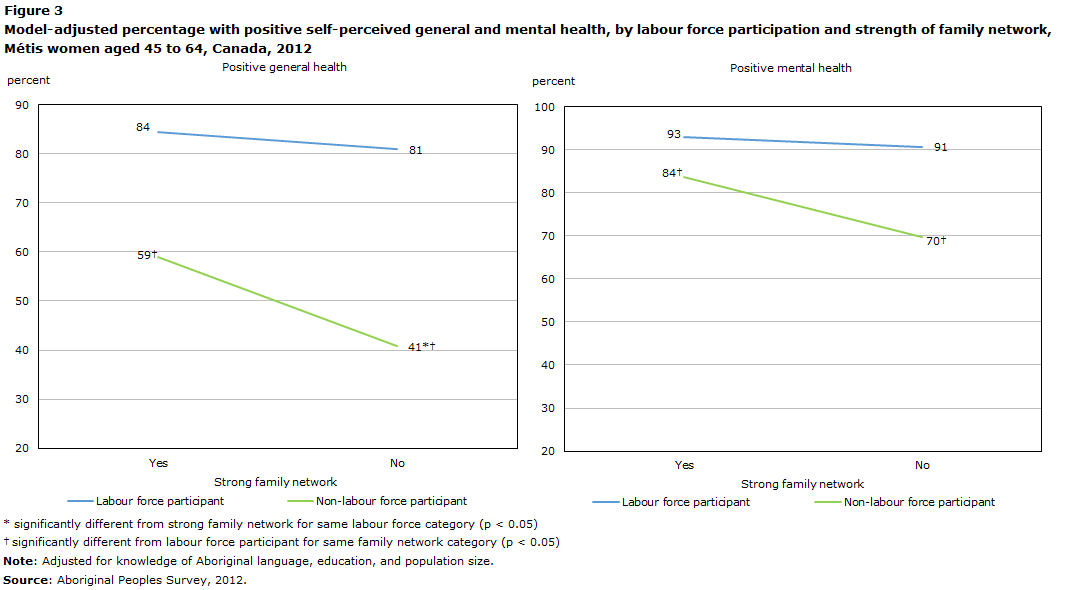
Data table for Figure 3
| Strong family network | Positive general health | |
|---|---|---|
| Yes | No | |
| percent | ||
| Labour force participant | 84.4 | 80.9 |
| Non-labour force participant | 59.0Data table Note † | 40.8Note * Data table Note † |
| Strong family network | Positive mental health | |
| Labour force participant | 93.0 | 90.7 |
| Non-labour force participant | 83.7Data table Note † | 69.8Data table Note † |
Source: Aboriginal Peoples Survey, 2012. |
||
- Date modified: