
Publications
Canadian Coroner and Medical Examiner Database: Annual Report
- 82-214-X
- Foreword
- Highlights
- Introduction
- General Statistics
- Future Work
- Appendix A: Distribution of coroner and medical examiner cases by manner and year
- Appendix B: Coroner and medical examiner cases by age group and manner
- Appendix C: Circumstances under which coroner or medical examiner investigation is required
- PDF version
- More information
Appendix A: Distribution of coroner and medical examiner cases by manner and year

Archived Content
Information identified as archived is provided for reference, research or recordkeeping purposes. It is not subject to the Government of Canada Web Standards and has not been altered or updated since it was archived. Please "contact us" to request a format other than those available.
Figure A-1
Distribution of C/ME cases by manner of death, Prince Edward Island, 2006 to 2008
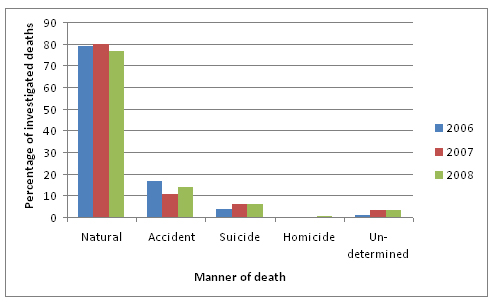
Source: Statistics Canada, Canadian Coroner and Medical Examiner Database, 2006 to 2008.
Natural deaths represented the majority of caseload share in Prince Edward Island (Figure A-1), accounting for 76% to 80% of C/ME investigations annually. These were followed by accidental deaths (11% to 17%), suicides (4% to 6%), undetermined deaths (1% to 3%) and homicides (there was single homicide investigated by the coroner's office over the period 2006 to 2008). In general, caseload shares were stable over the three-year period, with slight increases to the proportion of suicides and undetermined deaths in 2007 and 2008 compared to 2006.
Figure A-2
Distribution of C/ME cases by manner of death, New Brunswick, 2006 to 2008
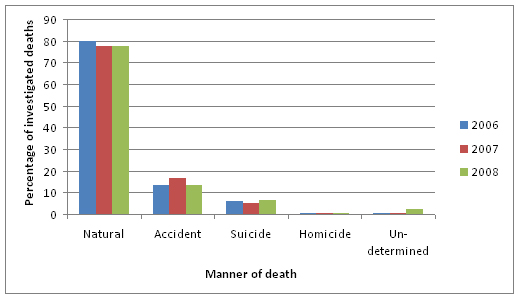
Source: Statistics Canada, Canadian Coroner and Medical Examiner Database, 2006 to 2008.
Natural deaths represented the majority of caseload share in New Brunswick (Figure A-2), accounting for 77% to 80% of C/ME investigations annually. These were followed by accidental deaths (13% to 17%), suicides (5% to 6%) and homicides (less than 1%) or undetermined deaths (less than 1% to 2%). In general, caseload shares were stable over the three-year period.
Figure A-3
Distribution of C/ME cases by manner of death, Quebec, 2006 to 2008
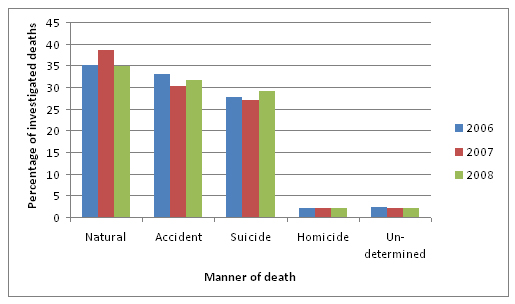
Source: Statistics Canada, Canadian Coroner and Medical Examiner Database, 2006 to 2008.
Natural deaths represented the largest portion of caseload in Quebec (Figure A-3), accounting for 35% to 38% of C/ME investigations annually. These were followed closely by accidental deaths (30% to 33%) and suicides (27% to 29%). Homicides and undetermined deaths each accounted for approximately 2% of C/ME investigations annually. In general, caseload shares were stable over the three year period, with greater agreement between 2006 and 2008 than with 2007.
Figure A-4
Distribution of C/ME cases by manner of death, Ontario, 2006 to 2008
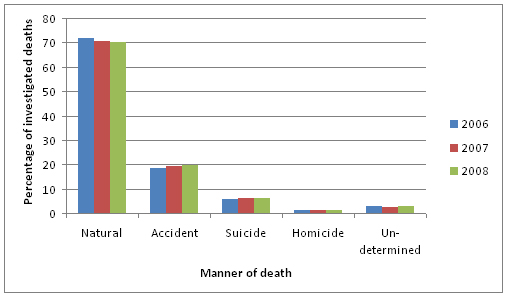
Source: Statistics Canada, Canadian Coroner and Medical Examiner Database, 2006 to 2008.
In Ontario (Figure A-4), natural deaths represented the majority of caseload share, accounting for 70% to 72% of C/ME investigations annually. These were followed by accidental deaths (18% to 20%), suicides (around 6%), undetermined deaths (around 3%) and homicides (around 1%). Caseload shares were stable over the three-year period.
Figure A-5
Distribution of C/ME cases by manner of death, Saskatchewan, 2006 to 2008
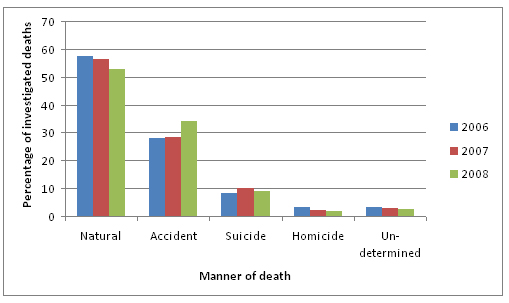
Source: Statistics Canada, Canadian Coroner and Medical Examiner Database, 2006 to 2008.
Natural deaths represented the majority of caseload share in Saskatchewan (Figure A-5), accounting for 53% to 57% of C/ME investigations annually. These were followed by accidental deaths (28% to 34%), suicides (8% to 10%) and homicides (2% to 3%) or undetermined deaths (2% to 3%). The increase in the share of accidental deaths over the three year period is offset in most part by a decrease in the share of natural deaths over the same period.
Figure A-6
Distribution of C/ME cases by manner of death, Alberta, 2006 to 2008
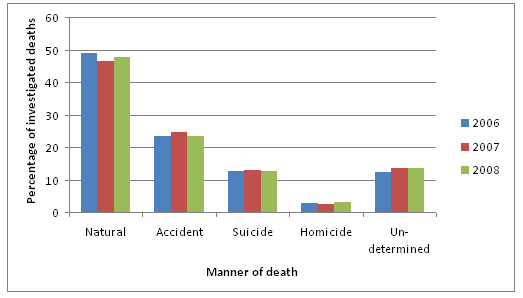
Source: Statistics Canada, Canadian Coroner and Medical Examiner Database, 2006 to 2008.
In Alberta (Figure A-6), natural deaths represented the largest portion of caseload, accounting for 47% to 48% of C/ME investigations annually. These were followed by accidental deaths (23% to 25%), undetermined deaths (12% to 14%), suicides (around 13%) and homicides (2% to 3%). Caseload shares were stable over the three-year period.
Figure A-7
Distribution of C/ME cases by manner of death, British Columbia, 2006 to 2008
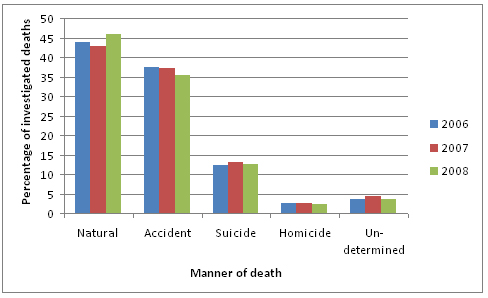
Source: Statistics Canada, Canadian Coroner and Medical Examiner Database, 2006 to 2008.
Natural deaths represented the largest portion of caseload in British Columbia (Figure A-7), accounting for 43% to 46% of C/ME investigations annually. These were followed by accidental deaths (35% to 37%), suicides (12% to 13%), undetermined deaths (3% to 4%) and homicides (2% to 3%). Annual caseload shares were stable, with small decreases to the share of accidental deaths and homicides over the three years.
Figure A-8
Distribution of C/ME cases by manner of death, Yukon, 2006 to 2008
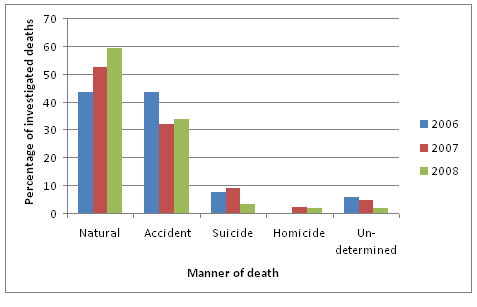
Source: Statistics Canada, Canadian Coroner and Medical Examiner Database, 2006 to 2008.
In the Yukon (Figure A-8), natural deaths represented the largest portion of caseload, accounting for 43% to 59% of C/ME investigations annually. These were followed by accidental deaths (32% to 43%), suicides (3% to 9%), undetermined deaths (2% to 6%) and homicides (0% to 2%). The Yukon showed greater variability in caseload share than the provinces, with a relatively large increase in the proportion of deaths deemed natural in 2007 (9 percentage points) and again in 2008 (7 percentage points), and a considerable decrease (11 percentage points) in the proportion of deaths deemed accidental in 2007. Smaller changes are observed for the other manners.
Figure A-9
Distribution of C/ME cases by manner of death, Northwest Territories, 2006 to 2008
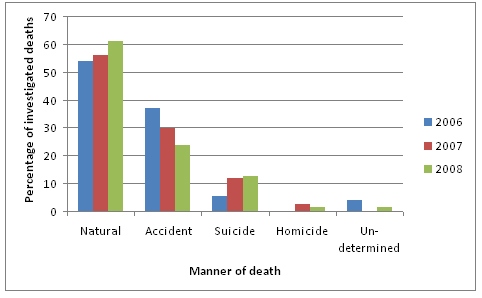
Source: Statistics Canada, Canadian Coroner and Medical Examiner Database, 2006 to 2008.
In the Northwest Territories (Figure A-9), natural deaths represented the majority of caseload share, accounting for 54% to 61% of C/ME investigations annually. These were followed by accidental deaths (24% to 37%), suicides (5% to 13%) and homicides (0% to 3%) or undetermined deaths (0% to 4%). Like the Yukon, the Northwest Territories showed greater variability in caseload share than the provinces, with relatively large increases in the proportion of deaths deemed natural (7 percentage points) or suicide (8 percentage points) over the three-year period, and a considerable decrease (13 percentage points) in the proportion deaths deemed accidental. Smaller changes are observed elsewhere.
- Date modified: