
Leisure-time physical activity

Archived Content
Information identified as archived is provided for reference, research or recordkeeping purposes. It is not subject to the Government of Canada Web Standards and has not been altered or updated since it was archived. Please "contact us" to request a format other than those available.
Physical activity is based on responses to questions about the frequency, nature and duration of participation in leisure time physical activity in the last three months by the population aged 12 or older. For each leisure-time physical activity reported, an average daily energy expenditure is calculated by multiplying the number of times the activity was performed by the average duration of the activity by the energy cost (kilocalories per kilogram of body weight per hour). The index is calculated as the sum of the average daily energy expenditures of all activities. Respondents are classified as:
- Active - Using 3 or more kilocalories per kilogram of body weight per day (for example, walking an hour or jogging 20 minutes a day).
- Moderately active - Using 1.5 to less than 3 kilocalories per kilogram of body weight per day (for example, walking 30 to 60 minutes a day or taking an hour-long exercise class three times a week).
- Inactive - Using less than 1.5 kilocalories per kilogram of body weight per day (for example, walking less than half an hour a day).
Self-reported percentages of physical activity may be affected by social desirability in reporting and recall bias. Leisure-time physical activity does not take into account energy expended in usual daily activities, at work or for transportation.
Importance of Indicator
The health benefits of physical activity are numerous: reduced risk of cardiovascular disease, some types of cancer, osteoporosis, diabetes, obesity, high blood pressure, depression, stress and anxiety1,2,3,4,5.
The economic impact of physical inactivity can be substantial6.
Monitoring trends in prevalence of physical activity is important for understanding population health risks, and for planning and evaluating policies and programs for the promotion of physical activity.
Background
Evidence indicates that 30 minutes of moderate-intensity exercise on most days provide some health benefits, notably, a decreased risk of chronic diseases, and that benefits increase from doing more, especially vigorous activities1.
Recent recommendations suggest that 60 minutes of moderate-intensity exercise per day is needed to prevent weight gain3,7.
Compared with those who were inactive, Canadian men and women who were at least moderately active during leisure time were more likely to rate their health excellent or very good (rather than good, fair or poor), reported lower levels of stress, were less likely to report high blood pressure, and were less likely to be overweight or obese. These relationships persisted when socio-demographic characteristics, non-leisure-time physical activity and activity restrictions were taken into consideration5.
Leisure-time physical activity was less prevalent among people in lower income groups, compared with the highest income group, even when socio-demographic characteristics, non leisure-time activity and activity restrictions were taken into account5.
Immigrants, regardless of how long they had been in Canada, were less likely to be at least moderately active in their leisure time than were Canadians overall, even when adjustments were made to account for the different age distributions of the two groups5,8.
Off-reserve Aboriginal people were more likely to be at least moderately active than were Canadians overall5,9.
Walking is the leisure-time physical activity practiced by the highest percentages of Canadian men and women (64% and 76%, respectively in 2005), and is done more frequently than other activities. Other leading leisure-time physical activities include gardening, home exercises, swimming, bicycling, jogging, dancing, and weight training5.
Highlights and graphs
Time trend
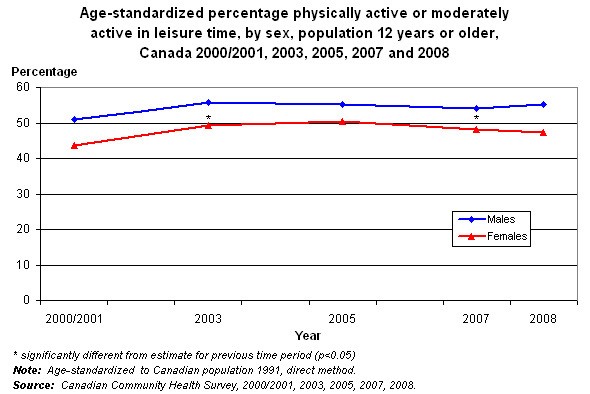
- The age-standardized percentage of Canadians reporting that they were active or moderately active increased between 2000/2001 and 2003.
- Females experienced a slight decline in reported leisure-time physical activity between 2005 and 2008, while the percentages for males remained stable.
- Males were consistently more likely than females to be active or moderately active.
Note: Age–standardized, direct method to 1991 Canada population.
Age group and sex

- In 2008 just over half of Canadian males (54.5%) aged 12 years or older reported being physically active or moderately active during leisure time, while just under half (46.8%) of females in the same age group reported this level of activity. This corresponds to an estimated 7.4 million males and 6.6 million females.
- With the exception of the 45 to 54 year old age group males were more likely to be active or moderately active than females.
- Males and females in the youngest age groups (under 25 years) were significantly more likely to report being active or moderately active than were Canadians overall. However, a large drop in physical activity rates is apparent for both sexes between the age groups of 12 to 17 and 18 to 24. This may be in part due to transitions in living arrangements, work and social environments that have been associated with decreased physical activity10,11.
- For males the rate drops below the overall rate for age groups starting at 35, while for females the rate does not drop below Canadian rate until age groups 55 and older.
Province
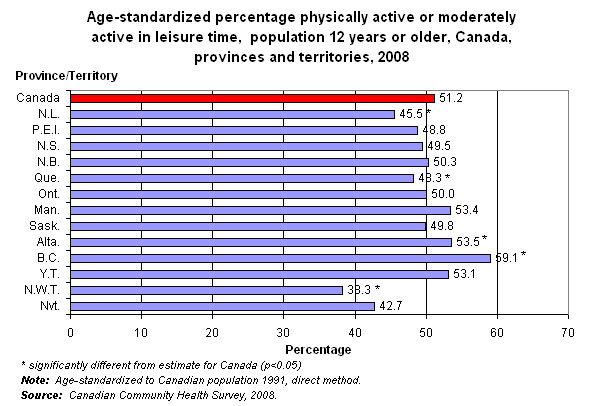
- Age-standardized percentages of leisure time physical activity did not vary widely across Canada.
- In 2008 residents of British Columbia and Alberta were more likely to report being active or moderately active than Canadians overall.
- The provinces of Newfoundland and Labrador and Quebec and the Northwest Territories reported lower percentages of physical activity when compared to the national percentages.
Note: Age–standardized, direct method to 1991 Canada population.
References
1. U.S. Department of Health and Human Services. Physical Activity and Health: A Report of the Surgeon General. Washington DC: US Department of Health and Human Services, 1996.
2. Chen J, Millar WJ. Health effects of physical activity. Health Reports (Statistics Canada, Catalogue 82-003) 1999;11(1):21-30.
3. Keim NL, Blanton CA, Kretsch MJ. America's obesity epidemic: measuring physical activity to promote an active lifestyle. Journal of the American Dietetic Association 2004; 104:1398-409.
4. Warburton DER, Nicol CW, Bredin SSD. Health benefits of physical activity: the evidence. Canadian Medical Association Journal 2006; 174(6): 801-9.
5. Gilmour H. Physically active Canadians. Health Reports (Statistics Canada, Catalogue 82-003) 2007; 18(3):45-66.
6. Katzmarzyk PT, Janssen I. The economic costs associated with physical inactivity and obesity in Canada: an update. Canadian Journal of Applied Physiology 2004; 29(1), 90-115.
7. Blair SN, LaMonte MJ, Nichaman MZ. The evolution of physical activity recommendations: how much is enough? American Journal of Clinical Nutrition 2004; 79(Suppl): 913S-20S.
8. Tremblay MS, Bryan SN, Pérez CE, Ardern CI, Katzmarzyk PT. Physical activity and immigrant status: evidence from the Canadian Community Health Survey. Canadian Journal of Public Health 2006;97(4):277-282.
10. Gordon-Larsen P, Nelson MC, Popkin BM. Longitudinal Physical Activity and Sedentary Behavior Trends Adolescence to Adulthood. American Journal of Preventive Medicine 2004;27(4):277-283.
11. Brown WJ, Trost SG. Life transitions and changing physical activity patterns in young women. American Journal of Preventive Medicine 2003;25(2):140 –3.
Other studies
Chen J, Millar WJ. Heart disease, family history and physical activity. Health Reports (Statistics Canada, Catalogue 82-003) 2001;12(4):23-32.
Chen J, Millar WJ. Starting and sustaining physical activity. Health Reports (Statistics Canada, Catalogue 82-003) 2001;12(4):33-43.
Connor Gorber C, Shields M, Tremblay MS, McDowell I. The feasibility of establishing correction factors to adjust self-reported estimates of obesity. Health Reports (Statistics Canada, Catalogue 82-003) 2008;19(3):71-82.
Guèvremont A, Findlay L, Kohen D. Organized extracurricular activities of Canadian children and youth. Health Reports (Statistics Canada, Catalogue 82-003) 2008;19(3):65-69.
Pérez CE. Children who become active. Health Reports (Statistics Canada, Catalogue 82-003) 2003; 14(Supplement):17-28.
Pérez CE. Personal health practices: Smoking, drinking, physical activity and weight. Health Reports (Statistics Canada, Catalogue 82-003) 1999; 11(3): 83-90.
Statistics Canada. Taking risks / Taking care. Health Reports (Statistics Canada, Catalogue 82-003) 2001;12(3):11-20.
Sithole F, Veugelers PJ. Parent and child reports of children's activity. Health Reports (Statistics Canada, Catalogue 82-003) 2008;19(3): 19-24.
- Date modified: