
Publications
Health Research Working Paper Series
The Health of Inuit, Métis and First Nations Adults Living Off-Reserve in Canada: The Impact of Socio-economic Status on Inequalities in Health
Data sources, methods, limitations, and technical notes

Archived Content
Information identified as archived is provided for reference, research or recordkeeping purposes. It is not subject to the Government of Canada Web Standards and has not been altered or updated since it was archived. Please "contact us" to request a format other than those available.
Data sources
This study used two data sources. The first, which provided health information for Aboriginal people, was the 2006 Aboriginal Peoples Survey (APS). The second data source, which provided health information for non-Aboriginal people, was the 2007 Canadian Community Health Survey (CCHS), Cycle 4.1. Both surveys contained similar health and socio-demographic questions which were used to compare health and socio-economic conditions between First Nations, Métis, Inuit and non-Aboriginal adults (ages 20 and up).
The Aboriginal Peoples Survey (APS) provides data on the social and economic conditions of First Nations people living off-reserve, Métis and Inuit, aged 6 years and older. As a post-censal survey, the 2006 APS used responses to the 2006 Census as a basis for sampling. Further details on the APS can be found elsewhere.22 The APS sample used in this study was limited to those aged 20 and older (n=25,236).
In the Census, and included in the APS, individuals reported whether they self-identified as an Aboriginal person. More specifically, individuals indicated whether they self-identified as First Nations (North American Indian), Métis or Inuit. Individuals who responded affirmatively to a single Aboriginal identity category were retained in the sample of Aboriginal respondents (n=20,086). Individuals who did not self-identify as Aboriginal (n=4,231), who responded to multiple categories in the Aboriginal identity question (n=472) or who indicated that they were part of some other Aboriginal identity population (n=447) were excluded from the sample. The final sample of Aboriginal adults included 4040 Inuit, 7279 Métis and 8767 First Nations adults living off-reserve.
As noted, the 2006 APS was only conducted off-reserve. Therefore, throughout this document, whenever the term "First Nations" is used, it refers only to First Nations people living off-reserve, and should not be interpreted as relating to First Nations people living on-reserve.
The CCHS is a cross-sectional survey that collects information related to health status, health care utilization and health determinants for the Canadian population aged 12 and older living in private dwellings in the 10 provinces and 3 territories. The CCHS excludes individuals living on Indian reserve communities, institutions, full-time members of the Canadian Armed Forces, and residents of remote regions of the country. Further details on the design and sampling frame for the CCHS can be found elsewhere.23 The CCHS sample used in this study was limited to those aged 20 and older (n=58,957).
As part of the CCHS, respondents were asked, "Are you an Aboriginal person, that is, North American Indian, Métis or Inuit?" Those who answered in the affirmative were excluded from the CCHS sample in the present study (n=2,671). Remaining respondents comprised the non-Aboriginal sample in analyses. The final sample included 56,286 non-Aboriginal adults.
Methods
Descriptive statistics (proportions, means) were compared using Z- and t-tests for independent samples. Because of differences in methodologies for constructing bootstrap weights between the two surveys, regression models that included both Aboriginal and non-Aboriginal respondents were sample weighted but not bootstrapped. This may result in variance estimates that are artificially small; therefore a more conservative p-value (0.01) was used in such analyses when determining statistical significance of estimates. However, proportions, means and regression models that were run separately for each Aboriginal identity group were bootstrapped using appropriate methodologies.
Sequential regression models: Interpreting odds ratios and the order of variable selection
The sequential model analysis examined the cumulative impact of various socio-economic, lifestyle and health care access factors on the health of First Nations, Métis and Inuit adults relative to that of non-Aboriginal adults. This impact is seen through the use of odds ratios, which compare the odds of a particular outcome for First Nations, Métis or Inuit adults relative to non-Aboriginal adults after taking other factors into account. Because non-Aboriginal adults form the reference group, their default value is 1.0, which is depicted by a horizontal line in Figures 4 through 8. In these figures, odds ratios (bars) and their associated 99% confidence intervals that do not include the value of 1.0 – or overlap the horizontal line – indicate that the odds of the health-related outcomes are significantly different from non-Aboriginal adults for First Nations, Métis or Inuit adults.
Although variables could have been added to the models in a number of ways, the rationale for the sequence of variables is as follows. Step 1 variables included age and sex, as age is known to vary between non-Aboriginal and Aboriginal populations and age and sex are known to be closely associated with health. Step 2 variables included income and education, as one of the objectives of this study was to determine whether health disparities between Aboriginal and non-Aboriginal adults were due to socio-economic differences. The three remaining steps in the model-building moved from individual (i.e. smoking status and BMI category) to contextual (i.e. urban place of residence) factors to take into account the broader determinants of health. The order chosen could impact the estimates from intermediary (steps 1 though 4) models, but estimates from step 5 would be the same regardless of the order of variable inclusion.
Determining diabetes type in the CCHS
In the 2007 CCHS cycle 4.1, respondents who indicated that they had been diagnosed with diabetes were not asked with what type of diabetes they had been diagnosed. However, using other information available in the survey, it is possible to use the Ng-Dasgupta-Johnson algorithm27 to impute diabetes type.
This seven-step algorithm determines diabetes type using the following information: whether diabetic women had been diagnosed with diabetes other than when pregnant; whether pills were used in the past month for the treatment of diabetes; whether the respondent was currently taking insulin; the individual's age at diagnosis of diabetes; the time between diagnosis and initiation of insulin treatment; and the respondents age at the time of interview.
In the final step of the Ng-Dasgupta-Johnson algorithm, diabetics that had not been classified to a diabetes type category in the previous steps were classified as Type 2. To maintain comparability with the information provided in the APS, where diabetics are allowed to indicate that they do not know their type of diabetes, CCHS diabetics that had not been otherwise classified by the seventh step were assigned a diabetes typology of "can't determine." Therefore, the rate of Type 2 diabetes presented in this report may differ from that reported by others using the same data source.
For further details on methods used in this study, see Technical notes.
Limitations
Unlike the CCHS, the APS was not designed as a health survey, but rather as an omnibus survey. As such, the number and scope of questions related to health in the APS were limited. Other more specific health-related measures may have better described the health status of Aboriginal people. However, a number of the health-related questions on the APS were comparable to ones in the CCHS, which allowed for cross-survey comparisons.
Further, other differences between the CCHS and the APS may contribute to significant differences between populations. These may include, but are not necessarily limited to, sampling procedures and interview methodologies. Therefore, significant differences found between samples may be due to differences in survey design and may not necessarily reflect true inter-population differences. However, these effects will likely be minimal when comparisons are made between populations within the APS sample, namely comparisons between Inuit, Métis and First Nations adults living off-reserve.
Relative to the non-Aboriginal sample, the sample of Inuit adults was relatively small. As a result, certain differences may not have reached statistical significance due to power constraints. Nevertheless, the number of Inuit in Canada is itself small, and the sample of Inuit respondents found in the APS is much larger than that found in other general population surveys. The smaller sample also precluded the examination of numerous health measures at the provincial/territorial level, particularly for the Inuit population.
Although the number of Aboriginal respondents available from the APS is much larger than from other surveys, the small sample relative to non-Aboriginal respondents also meant that the samples could not be further subdivided to reflect more specific groups. For example, the sample of First Nations respondents could have been further subdivided into individuals who were Registered (Status) Indians and those who were not. Similarly, Inuit respondents could have been further categorized as living in Inuit Nunangat – the Inuit homeland – or in the south. Although these subdivisions may have highlighted further cross-group differences, the size of the sample precluded such analyses.
All health-related information from the CCHS and the APS was based on self-report. Although much self-reported information has been shown to be valid and reliable, some measures may be biased. However, it is not known whether the potential bias introduced by self-report applies equally to Aboriginal and non-Aboriginal adults, or whether the magnitude or direction of this bias differs by Aboriginal identity group.
Technical notes
Both the CCHS and the APS include sample weights that allow the analyst to calculate estimates that are generalizable to the larger population. Each survey also employs the use of bootstrap weights to adjust variance estimates for the complexities of each survey's design. However, the number and nature of replicates differ between the two surveys. The CCHS employs 500 replicate weights, whereas the 2006 APS employs 1000 replicate weights. Furthermore, variance estimation using the 2006 APS bootstrap weights must be adjusted using Fay's factor, whereas this is not the case when using CCHS data. Given that these inter-survey differences could not be addressed in a single model or test, other methods were used in analyses that required comparisons between Aboriginal and non-Aboriginal respondents (e.g. comparing proportions or means), or analyses that were based on a single model that included both the Aboriginal and non-Aboriginal samples.
Calculating and comparing descriptive statistics
Descriptive statistics (proportions, means) were calculated separately for Aboriginal and non-Aboriginal respondents, using the appropriate sample and bootstrap weights for the particular survey. To compare proportion estimates between Aboriginal and non-Aboriginal respondents, the following equations were used:
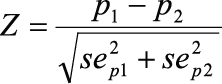
where p1 and p2 are the proportions from each sample and sep1 and sep2 are the standard errors of the proportions.
To compare mean estimates between Aboriginal and non-Aboriginal respondents, the following equations were used:
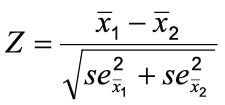
where ![]() and
and ![]() are the mean estimates from the two independent samples, se x1and se x2 are the standard error estimates of the two means.
are the mean estimates from the two independent samples, se x1and se x2 are the standard error estimates of the two means.
Comparing estimates from a single logistic regression model
For certain analyses, CCHS and APS data were included in a single model in order to compare the relative impact of Aboriginal identity on a particular outcome. In such analyses where the model included both Aboriginal and non-Aboriginal respondents, models were weighted using a normalized sampling weight. In lieu of bootstrapping the model, which would normally adjust variance estimates to account for the complex survey design but could not be undertaken due to the aforementioned differences in the number and nature of bootstrap weights for the two surveys, a more conservative alpha value (p<.01) was used to identify effects that were considered statistically significant. As such, rather than reporting 95% confidence intervals, 99% confidence intervals are reported from such analyses in this report.
Comparing estimates from separate logistic regression models
A series of analyses in this report involved examining whether socio-economic characteristics or lifestyle behaviours had similar impacts on measures of health for both Aboriginal and non-Aboriginal adults. This was accomplished by comparing logistic coefficients (or their related odds ratios) across independent samples. An often ignored issue when making such comparisons is that residual variation may not be distributed in the same manner across independent samples.39,40 If residual variation does differ across samples, then apparent differences in coefficients may be due to differences in residual variation and not due to true differences in effect between the two samples.
To address this issue, analyses were run in several ways. First, logistic models were run separately for each Aboriginal identity group (non-Aboriginal, First Nations off reserve, Métis, Inuit) using the appropriate sample and bootstrap weights and procedures for the particular survey. Such analyses were run in SAS-callable SUDAAN (version 10). The odds ratios generated from these models are shown in Tables 7 through 11.
Next, to address the issue of differences in residual variation, and to enable testing for significant differences in effects across models, models were re-run using the software program Mplus (version 4.1). Using theta parameterization options, the residual variation was fixed to be equal across all models. With residual variation now equal across models, it was possible to compare the resultant coefficients to examine true differences in effect across samples. Coefficients were compared across models using the following formula:
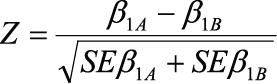
where (β1A) and (β1B) represent the coefficients for the effects of the same characteristic in samples A and B, respectively, and where (SEβ1A) and (SEβ1B) are the standard errors of these same coefficients. Tests of significance where p<.05 are denoted by superscripts in Tables 7 through 11.
- Date modified: