
Violent victimization of Aboriginal people in the Canadian provinces, 2009

Archived Content
Information identified as archived is provided for reference, research or recordkeeping purposes. It is not subject to the Government of Canada Web Standards and has not been altered or updated since it was archived. Please "contact us" to request a format other than those available.
By Samuel Perreault
- Aboriginal victimization higher than non-Aboriginal victimization
- Non-spousal violence
- Spousal violence
- Reporting victimizations to police
- Impacts of violent victimization
- Perceptions of personal safety
- Summary
- Detailed data tables
- References
- Methodology for the multivariate analysis
- Methodology for the General Social Survey on Victimization
-
Notes
A number of previous studies have indicated that Aboriginal people tend to be highly represented as victims (Brzozowski 2006) and perpetrators of crime (Charron 2010; Brzozowski 2006) as well as among incarcerated persons (Perreault 2009). These studies have been useful in developing policies and programs suited to the distinct social context in which Aboriginal people live. Yet, there continue to be challenges in obtaining comprehensive data on the involvement of Aboriginal people in the justice system (Perreault 2009; Brzozowski 2006).
The General Social Survey (GSS) on Victimization is one available source of data that can be used to measure the nature and extent of Aboriginal victimization. This survey collects information from a representative sample of Canadians regarding their victimization experiences for eight types of crime: sexual assault, robbery, assault, break and enter, theft of motor vehicles or parts, theft of household property, vandalism and theft of personal property.
This Juristat article presents information from the GSS on criminal victimizations as reported by Aboriginal people living in the ten provinces during 2009,1 with a particular focus on violent victimizations (see Text box 1 for complete definitions).2 It analyses the characteristics associated with such incidents, including the socio-demographic risk factors, consequences of victimization, reasons for reporting (and not reporting) incidents to police, perceptions of personal safety and perceptions of the criminal justice system. In addition, information on Aboriginal victims and persons accused of homicide is presented.3
Text box 1
Definitions
In 2009, the GSS measured the nature and extent of victimization in Canada, including victimization of Aboriginal people, by looking at three types of violent crimes, four types of household crimes and theft of personal property. When an incident included more than one type of crime, it was classified according to the most serious offence (in the order shown below). For information on break and enter, motor vehicle theft, theft of household property and vandalism, see Perreault and Brennan 2010.
| Violent Victimization | Description |
|---|---|
|
Sexual assault
|
Forced sexual activity, an attempt at forced sexual activity, or unwanted sexual touching, grabbing, kissing, or fondling. |
|
Robbery
|
Theft or attempted theft in which the perpetrator had a weapon or there was violence or the threat of violence against the victim. |
|
Physical assault
|
An attack (victim hit, slapped, grabbed, knocked down, or beaten), a face-to-face threat of physical harm, or an incident with a weapon present. |
| Theft of personal property | Theft or attempted theft of personal property such as money, credit cards, clothing, jewellery, a purse or a wallet (unlike robbery, the perpetrator does not confront the victim). |
| Aboriginal identity | Refers to those persons who reported identifying with at least one Aboriginal group, that is, North American Indian, Métis or Inuit. Because of a relatively low number of respondents, distinction between Aboriginal groups is not possible when using GSS data. |
End of text box
Aboriginal victimization higher than non-Aboriginal victimization
In 2009, almost 322,000 Aboriginal people aged 15 years or older, or more than one-third (37%) of the Aboriginal population living in the provinces, reported having been a victim of at least one of the eight offences covered by the General Social Survey in the preceding 12 months. This compares to about one-quarter (26%) of non-Aboriginal people who reported having been victimized over the same period.
Among all incidents reported by Aboriginal people, theft of personal property was the most common, accounting for 26% of all incidents. Combined, break and enter, theft of motor vehicles or parts, theft of household property and vandalism accounted for another 33%. The remaining 41% of incidents involved violent incidents, namely, sexual assault, robbery and assault. Of those violent incidents, 15% were sexual or physical assaults committed by a spouse or common-law partner (current or former) in the 12 months preceding the survey. The remainder of the article focuses primarily on the nature of these violent incidents.
Non-spousal violence
For the purposes of this article, violent victimization is divided into two sections: non-spousal violence and spousal violence. Non-spousal violence includes sexual assaults, robberies and assaults committed by anyone but the victim's partner (e.g., friends, acquaintances, strangers, other family members) that occurred in the 12 months preceding the survey. Spousal violence, on the other hand, includes sexual assaults and assaults committed by a current or former spouse or common-law partner that occurred in the 5 years preceding the survey.
Although there is no legal distinction between non-spousal and spousal violence, risk factors and consequences for victims may differ depending on the perpetrator of the violence. Research shows that non-spousal violence is more often an isolated incident, whereas spousal violence tends to be part of a pattern of on-going abuse (INSPQ 2010; NCVC 2010; Frigon 1996; Walker 1984).One in ten Aboriginal people report being violently victimized
Aboriginal people are more likely than non-Aboriginal people to be the victim of non-spousal violence. In 2009, 12% of Aboriginal people reported being the victim of at least one non-spousal violent crime, more than double the proportion of non-Aboriginal people (5%). In total, Aboriginal people self-reported 173,600 non-spousal violent incidents representing a rate of 198 violent incidents for every 1,000 Aboriginal people. (Table 1 and Chart 1)
Aboriginal people are also more likely than non-Aboriginal people to report being victimized multiple times. In 2009, nearly one-quarter (23%) of victims had been a victim of more than one non-spousal violent incident, compared to 19% of non-Aboriginal victims. These Aboriginal victims of multiple non-spousal violent crimes accounted for 41% of the non-spousal violent incidents reported by Aboriginal people.
Of all non-spousal violent incidents reported by Aboriginal people, assaults were the most common, at 107E incidents per 1,000.4 Assaults were also the most common type of victimization self-reported by non-Aboriginal victims (58 per 1,000). However, the gap between Aboriginal (70E incidents per 1,000) and non-Aboriginal victims (23 per 1,000) was proportionally greater for sexual assaults.
Chart 1
Self-reported non-spousal violent victimizations, Canada's ten provinces, 2009
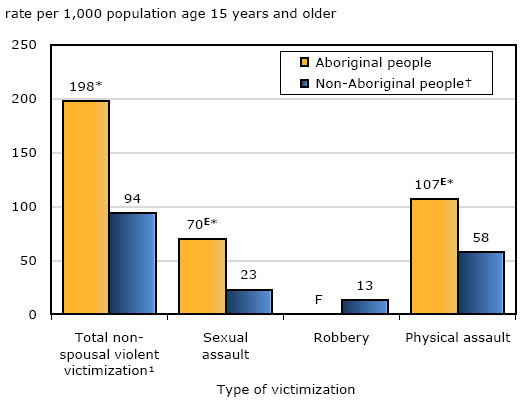
† Reference category
* significantly different from reference category (p < 0.05)
F too unreliable to be published
1. Includes robbery and excludes all incidents of spousal sexual and physical assault. Includes incidents that occurred during the 12 months preceding the survey.
Source: Statistics Canada, General Social Survey, 2009.
Text box 2
Homicide: Aboriginal people as homicide victims and accused persons
The Homicide Survey collects detailed information on all homicides that occur in Canada, including the Aboriginal identity of victims and accused persons. It is important to note, however, that information on Aboriginal identity is not reported to the Homicide Survey or is unknown for a sizeable proportion (approximately half) of all homicides. The following analysis focuses solely on the characteristics of homicides that occurred in the provinces and for which Aboriginal identity was known. From 2004 to 2009, police reported 330 homicides with an Aboriginal victim and 417 with an Aboriginal accused.
Most of these homicides involved the use of drugs or alcohol. About three quarters (73%) of victims and 91% of accused had used alcohol and/or drugs (or another intoxicant) at the time of the incident.
As with violent crimes in general, most of the Aboriginal accused were young males. Males accounted for 82% of Aboriginal accused with an average age of 24 years old.
End of text box
Youth and young adults at highest risk of violent victimization
As noted by Perreault and Brennan (2010), many socio-demographic factors collected by the GSS were found to be associated with overall violent victimization, both for Aboriginal and non-Aboriginal people. Some of these factors related to victim demographics such as sex, age or marital status; while others related to victim lifestyle characteristics such as their alcohol consumption, drug use or participation in evening activities.5
The GSS shows several of these risk factors were self-reported more frequently by Aboriginal people than by non-Aboriginal people (Table 2).6 When all these known risk factors were taken into account (See models 1 and 2), the risk of victimization of Aboriginal people remained 58% higher than that of non-Aboriginal people.
Similar to victimization among non-Aboriginal people, age was the primary risk factor for victimization against Aboriginal people. Those aged 15 to 24 years were the victims in nearly half (47%) of non-spousal violent incidents reported by Aboriginal people, whereas people in this age group represented 22% of the Aboriginal population aged 15 and over. As a rate, there were 425E violent incidents for every 1,000 Aboriginal people aged 15 to 24 years. The corresponding rate for non-Aboriginal people was 268 per 1,000.
Victimization of Aboriginal people associated with alcohol and drug use
Another factor found to be associated with a higher risk of violent victimization was drug use. Aboriginal people who reported using drugs at least once in the previous month had four times the risk of victimization compared to those who reported never using drugs. Also, Aboriginal people who reported that the presence of individuals using or selling drugs was a problem in their neighbourhood had a higher victimization rate than those who did not (277E versus 168) (Table 3).
The GSS also collects data from victims on various characteristics of the perpetrators, including the perpetrator's alcohol and drug use7. Aboriginal victims were more likely than non-Aboriginal victims to feel that the incident could have been related to the perpetrator's alcohol or drug use. More specifically, in nearly two-thirds (67%) of non-spousal violent incidents, the Aboriginal victim felt that the incident was related to the perpetrator's alcohol or drug use. This compares to 52% among non-Aboriginal people (Table 4).
Most violent victimizations do not involve a weapon
Generally speaking, most violent victimizations do not involve the use of a weapon, such as a firearm or a knife (Perreault and Brennan 2010). This is particularly true for victimizations against Aboriginal people. In 2009, 82% of violent incidents against Aboriginal people did not involve a weapon compared to 70% of incidents against non-Aboriginal people (Table 4).
Perpetrators of violent victimizations often known to victims
Both Aboriginal and non-Aboriginal victims of non-spousal violence often know their perpetrator. In 2009, 68% of Aboriginal victims and 52% of non-Aboriginal victims were victimized by a relative, a friend, an acquaintance, a neighbour or another person known to them (Table 4). The higher proportion of Aboriginal people who knew their perpetrator may be related to the higher incidence of sexual assault among Aboriginal people as this type of offence was more likely to be committed by someone known to the victim than other forms of violence (Perreault and Brennan 2010). As well, a larger proportion of Aboriginal people than non-Aboriginal people (56% versus 31%) live outside census metropolitan areas8 and may therefore be more likely to know a greater proportion of people in their community (Table 3).
As is the case with violent victimization in general (Perreault and Brennan 2010), most non-spousal violent victimizations were committed by young adult males. About three-quarters of perpetrators of violent victimizations against Aboriginal people were male, and more than half of perpetrators (57%) were between 25 and 44 years of age (Table 4).
Spousal violence
This section focuses on violence committed by a current or former spouse or common-law partner. Although spousal violence may involve many types of violent crime or abuse, the GSS only collects information on incidents of spousal violence that involve sexual or physical assault. Also, because of a small sample size and to allow more details to be presented, the analysis focuses on spousal violence that occurred in the five years preceding the survey.
Aboriginal people were almost twice as likely as non-Aboriginal people to report being a victim of spousal violence
As is the case with non-spousal violence, Aboriginal people who had a spouse or common-law partner in the last five years were more likely than non-Aboriginal people to report being the victim of a sexual or physical assault by their spouse. Aboriginal people (10%) were almost twice as likely as non-Aboriginal people (6%) to report being a victim of spousal violence in the five years preceding the survey (Chart 2).
Chart 2
Self-reported spousal victimizations in the preceding 5 years, Canada's ten provinces, 2009
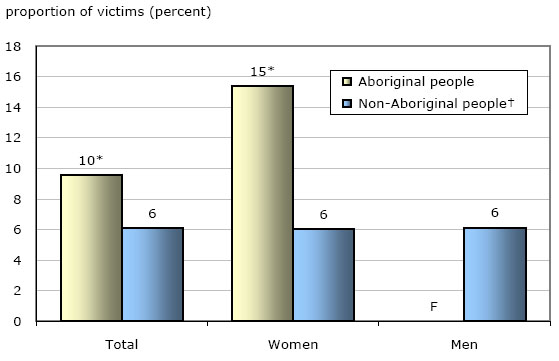
† reference category
* significantly different from reference category (p < 0.05)
F too unreliable to be published
Source: Statistics Canada, General Social Survey, 2009.
Aboriginal women, in particular, were at greater risk than non-Aboriginal women of being victims of spousal violence. About 15% of Aboriginal women who had a spouse or common-law partner in the past five years reported being a victim of spousal violence, more than twice the proportion among non-Aboriginal women (6%).
Not only were Aboriginal people more likely than non-Aboriginal people to be physically or sexually assaulted by a spouse or partner (current or former), they were also more likely to report having been victimized multiple times. More than half (59%) of Aboriginal victims of spousal violence reported being victimized more than once in the past five years and 50% reported being victimized more than three times. In comparison, 43% of non-Aboriginal victims reported being victimized more than once and 29% more than three times.
Aboriginal victims of spousal violence were more likely than other Aboriginal people to be victims of non-spousal violence. Aboriginal people who self-reported spousal violence were also about three times more likely than other Aboriginal people to have been the victim of a non-spousal violent crime.
Aboriginal victims of spousal violence were also more likely than non-Aboriginal victims to report suffering the most serious forms of spousal violence. More specifically, Aboriginal victims were nearly twice as likely to report being hit with an object, beaten, strangled, threatened or assaulted with a firearm or a knife, or forced to engage in an unwanted sexual act (60%E versus 33% for non-Aboriginal people). Proportionally, twice as many Aboriginal victims as non-Aboriginal victims said they were injured (57% versus 29%), and more than twice as many said they feared for their lives (48%E versus 18%) (Table 9).
Text Box 3
Theft of personal property
Of the eight types of offences measured by the General Social Survey, theft of personal property was the most widespread form of victimization reported by Aboriginal people. Theft of personal property was one of the few types of offences for which Aboriginal people had a victimization rate that was not statistically different from that of non-Aboriginal people (145 versus 107 per 1,000 people).
The personal property theft rate for Aboriginal people did not vary much with individual characteristics. Only drug use was associated with a higher rate of victimization for theft (314 versus 110 for Aboriginal people who never take drugs) (Table 5).
Some neighbourhood characteristics were associated with an increased risk of theft of personal property, for both Aboriginal and non-Aboriginal people. For example, the rate was higher in neighbourhoods where the proportion of home owners was below average and where the proportion of lone-parent families was above average. The rate also tended to be higher in neighbourhoods where respondents reported problems associated with graffiti and vandalism, people using or selling drugs and people who were drunk or rowdy in public places (Table 6).
End of text box
Reporting victimizations to police
Aboriginal victims more likely to report spousal violence to police
The reporting rate for non-spousal violent incidents was similar for Aboriginal people (26%E) and non-Aboriginal people (29%) (Chart 3). In contrast, the reporting rate for situations involving spousal violence in the 5 years preceding the survey was higher among Aboriginal than non-Aboriginal people. Aboriginal victims were twice as likely as non-Aboriginal victims to report their victimization to police (29% compared to 15%). When including incidents where police became aware in some other way (e.g. friend relative or witness notified police), a total of 35% of spousal violence situations were brought to the attention of police.
Since reporting rates are similar when there are injuries, the higher reporting rate by Aboriginal people may be partly due to the greater severity and consequences of spousal violence among Aboriginal victims. While 40%E of Aboriginal victims of spousal violence said they did not call the police because they felt the incident was not serious enough, this was the case among 71% of non-Aboriginal victims.
Other reasons often cited for not contacting the police, for both non-spousal and spousal violence incidents, were that the victim did not want to get involved with the police or that the matter was settled in another way (Table 7).
Aboriginal victims of spousal violence who contacted the police were generally satisfied with the action taken (73%). This result was similar for non-Aboriginal victims.
About one-third (33%E) of Aboriginal victims of spousal violence sought help from a formal service other than the police, such as a community center or a victim service (Table 8). According to a recent survey of victim services, 28% of services had programs specifically designed for Aboriginal people (Sauvé 2009).
Chart 3
Self-reported victimization incidents, by reporting to police, Canada's ten provinces, 2009
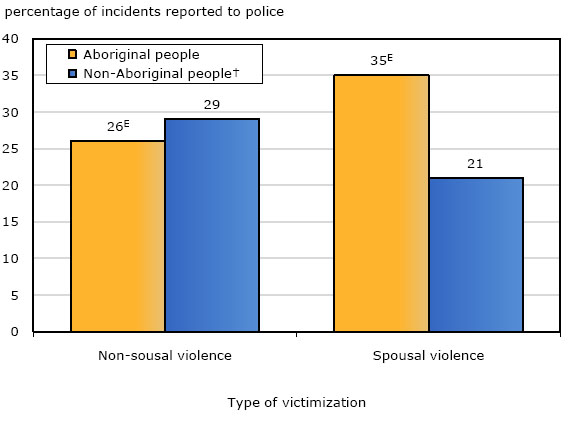
† reference category
* significantly different from reference category (p < 0.05)
E use with caution
Note: For spousal violence, the violent situation is considered as a whole as opposed to considering the incidents separately. If spousal violence has been reported at one time or another, then the violence is considered to be reported even if other incidents were not reported. Also, spousal violence is examined during the preceding five years, while non-spousal violent incidents are examined during the 12 months preceding the survey.
Source: Statistics Canada, General Social Survey, 2009.
Most Aboriginal victims of violence seek support from friends or family members
Regardless of whether or not victims choose to inform the police or seek help from another formal service, most tell someone about the violent incident. There are differences between Aboriginal and non-Aboriginal people, however, depending on the nature of the violent incident. More specifically, while both groups were about equally likely to confide in someone about non-spousal violence, Aboriginal people were more likely to tell someone, usually a family member, a friend or a neighbour, about incidents committed against them by their spouse. In 2009, 94% of Aboriginal people and 67% of non-Aboriginal people told someone about the spousal violence.
Impacts of violent victimization
Anger most common emotional response
In addition to physical injuries and fearing for their lives, victims may suffer other emotional or social consequences. As was observed for violent victimization in general (Perreault and Brennan 2010), one of the most common responses reported in 2009 was anger, experienced by just over one-third of both Aboriginal and non-Aboriginal victims. About one-third of victims also stated having been upset, confused or frustrated as a consequence of the victimization.
Some victims found it difficult or impossible to carry out their daily activities following the victimization. One-third of Aboriginal victims stated that they had to take time away from their daily activities for at least a day because of the victimization (Table 9).
Many victims of spousal violence living in lone-parent family
Although it is unknown if a change in the victim's family structure was a direct consequence of the abuse, many Aboriginal victims of violence by an ex-spouse (or common-law partner) were living in a lone-parent family at the time of the survey. Of those Aboriginal victims who had a child with their ex-spouse9, 76% were single parents, usually single mothers. This compares to 56% of their non-Aboriginal counterparts. Overall, 16% of all Aboriginal people living in a lone-parent family experienced spousal violence in the last five years.
Moreover, when Aboriginal victims had a child with their ex-spouse, more than half (58%) of these children witnessed the abuse. This figure was similar for non-Aboriginal victims (65%).
Perceptions of personal safety
In addition to collecting information on Canadians' victimization experiences, the GSS asks a series of questions on respondents' perceptions of their personal safety and the Canadian justice system. The survey also asks respondents to assess the level of social disorder in their neighbourhood. To do so, respondents evaluate whether various situations, such as the presence of graffiti, garbage in the street, people using or selling drugs or prostitution are a problem in their neighbourhood (se Table 12 for a list of all social disorder situations that were evaluated).
Majority of Aboriginal people satisfied with their personal safety
Despite higher victimization rates and a greater likelihood of reporting social disorder in their neighbourhood, most Aboriginal people reported being satisfied with their personal safety from crime (89%).
Overall, Aboriginal and non-Aboriginal people had fairly similar perceptions about crime. For example, about 6 in 10 (62%) Aboriginal and non-Aboriginal people believed that the number of crimes committed in their neighbourhood remained stable in the last five years. Similarly, almost the same proportion of Aboriginal (37%) and non-Aboriginal people (38%) said they felt safe or very safe walking alone after dark. On the other hand, Aboriginal people who did not feel safe doing so were more likely to say that they would walk alone more often after dark if they felt safer (55% versus 38%) (Table 10).
Although Aboriginal people were as satisfied with their personal safety as non-Aboriginal people, they were more likely to report having adopted some measures to protect themselves from crime. For example, 43% of Aboriginal people said they changed their routine, activities or avoided certain people or places and 16% said they obtained a dog to protect them from crime. The corresponding proportions for non-Aboriginal people were 36% and 9%, respectively. However, Aboriginal people (25%) were less likely than non-Aboriginal people (35%) to report having installed burglar alarms or motion detector lights (Table 11).
Most Aboriginal people have positive perceptions of their neighbourhood
In general, the majority of Aboriginal people did not perceive problems of social disorder in their neighbourhood. However, larger proportions of Aboriginal than non-Aboriginal people felt that the following signs of social disorder were a problem in their neighbourhood: people using or selling drugs (37% versus 27%); people who were drunk or rowdy (37% versus 25%); garbage lying around (39% versus 29%), or; vandalism (41% versus 32%) (Table 12).
Aboriginal people have a generally favourable perception of their local police service
In general, the majority of Aboriginal people believe that their local police service does a good or average job with regard to the aspects of police work covered by the survey (Table 13). However, Aboriginal people were less likely than non-Aboriginals to believe that their police service was doing a good job of treating people fairly (47% versus 59%) and of enforcing the law (51% versus 60%). Aboriginal people were also less likely than non-Aboriginals to have confidence in their local police service (70% versus 84%) (Chart 4).
Chart 4
Level of confidence in local police, by Aboriginal identity, Canada's ten provinces, 2009
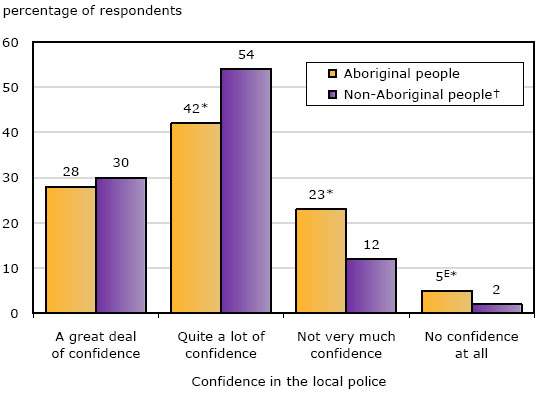
† reference category
* significantly different from reference category (p < 0.05)
E use with caution
Note: Total may not add up to 100% due to rounding and "Don't know" and "Not stated" categories included in the total.
Source: Statistics Canada, General Social Survey, 2009.
Aboriginal people tended to have less favourable opinions of the criminal courts than of their local police, although their perceptions were generally similar to those of non-Aboriginal people. On the other hand, slightly higher percentages of Aboriginal than non-Aboriginal people felt that the prison system was doing a poor job of supervising prisoners and helping them become law-abiding citizens (Table 13).
Contact with the justice system is a factor that can influence one's perceptions of that system. The 2009 GSS shows that Aboriginal people were more likely to have had contact with the justice system. Specifically, 42% of Aboriginal people and 37% of non-Aboriginal people had contact with the police in the 12 months preceding the survey. Aboriginal people were more likely than non-Aboriginal people to have had contact with the police in the context of a public information session (13% compared to 8%) and for being arrested (3%E compared to 1%). Moreover, about one-third of Aboriginal people had contact with the criminal court system at some point in their lives. This compares to 21% of non-Aboriginal people.
Summary
In 2009, about 1 in 10 Aboriginal people reported having been the victim of a non-spousal violent crime in the 12 months preceding the survey, more than double the proportion of non-Aboriginal people. For both Aboriginal and non-Aboriginal victims, several factors were found to be associated with higher victimization rates, including being young, single and using drugs. When comparing Aboriginal and non-Aboriginal people with similar socio-demographic characteristics, the risk of victimization remained 58% higher for Aboriginal people than non-Aboriginal people.
Moreover, Aboriginal people were almost twice as likely as non-Aboriginal people to report having been the victim of spousal violence in the 5 years preceding the survey. Aboriginal victims of spousal violence were also more likely than non-Aboriginal victims to report multiple incidents, more severe forms of violence and injuries. Aboriginal victims of spousal violence were also at greater risk of being the victim of a non-spousal violent crime.
As it is the case with victimization in general, fewer than 1 in 3 incidents was reported to police. However, Aboriginal victims of spousal violence were more likely than their non-Aboriginal counterparts to report the violence to police.
Detailed data tables
Table 11 Use of crime prevention measures, by Aboriginal identity, Canada's ten provinces, 2009
References
Brzozowski, Jodi-Anne, Andrea Taylor-Butts and Sara Johnson. 2006. "Victimization and offending among the Aboriginal population in Canada". Juristat. Vol. 26, no. 3. Statistics Canada Catalogue no. 85-002-X. (accessed on January 14, 2011).
Brzozowski, Jodi-Anne and Karen Mihorean. 2002. Technical Report on the Analysis of Small Groups in the 1999 General Social Survey. Statistics Canada Catalogue no. 85F0036XIE. (accessed on January 14, 2011).
Charron, Mathieu, Christopher Penney and Sacha Senécal. 2010. Police-reported crime in Inuit Nunangat. Statistics Canada Catalogue no. 85-561-X. Crime and Justice Research Paper Series, no. 20. (accessed on January 14, 2011).
Frigon, Sylvie. 1996. "L'homicide conjugal au féminin, de Marie-Joseph Corriveau (1763) à Angélique Lyn Lavallée (1990) : meurtre ou légitimer défense?". Criminologie, vol. 29, no. 2.
Institut national de santé publique du Québec (INSPQ). 2010. Web site (accessed on November 17, 2010).
National center for victims of crime (NCVC). 2010. Web site (accessed on November 17, 2010).
Perreault, Samuel and Shannon Brennan. 2010. "Criminal victimization in Canada, 2009". Juristat.Vol. 30, no. 2. Statistics Canada Catalogue no. 85-002-X. (accessed on January 14, 2011).
Perreault, Samuel and Rebecca Kong. 2009. "The incarceration of Aboriginal people in adult correctional services". Juristat.Vol. 29, no. 3. Statistics Canada Catalogue no. 85-002-X. (accessed on January 14, 2011).
Sauvé, Julie. 2010. "Victims services in Canada, 2007/2008". Juristat.Vol. 29, no. 4. Statistics Canada Catalogue no. 85-002-X. (accessed on January 14, 2011).
Walker, L. 1984. The Battered Woman Syndrome. New York, Harper Colophon Books.
Methodology for the multivariate analysis
Several socio-demographic factors associated with an increased risk of violent victimization are more common in the Aboriginal population than the non-Aboriginal population. Also, these factors seldom exist in isolation. For example, being young is associated with participating in evening activities and single marital status, both of which are factors related to the risk of victimization. In order to evaluate the contribution of each factor to the risk of victimization independently, the logistic regression technique was used. According to this technique, the effect of each factor is measured while holding the other factors constant and it is expressed in terms of the odds ratio.
The odds ratio indicates the contribution to the risk of victimization in relation to the reference group. For example, in Model 1, age is the main risk factor: those aged 15 to 24 years are 6.2 times more likely than those aged 55 and over to be victimized. Similarly, the risk victimization among separated/divorced or single persons is, respectively, 1.8 and 1.5 times higher than the risk for married persons.
| Characteristics1 | Odds ratio |
|---|---|
| Aboriginal Identity | |
Non-Aboriginal | reference |
Aboriginal | 1.58* |
| Age | |
Aged 55 and over | reference |
15 to 24 | 6.2*** |
25 to 34 | 4.49*** |
35 to 44 | 3.59*** |
45 to 54 | 2.83*** |
| Marital Status | |
Married/common-law | reference |
Single | 1.53*** |
Other marital status2 | 1.76*** |
| Immigrant status | |
Non-immigrant | reference |
Immigrant | 0.58*** |
| Activity limitation | |
No limitation | reference |
Limited in activities | 1.56*** |
| Number of activities at night (each month) | |
Less than 30 | reference |
30 or more | 1.44*** |
| Use of drugs | |
Never uses drugs | reference |
Used drugs at least once in past month, but not every day | 2.31*** |
Uses drugs daily | 3.96*** |
| Probability that a neighbour would call the police if they witnessed what seemed like criminal behaviour | |
Probable | reference |
Not so probable | 1.74*** |
| People using or dealing drugs in the neighbourhood? | |
No | reference |
Yes | 1.91*** |
| * Significant at p < 0.05 *** Significant at p < 0.001 1. Non-significant variables were excluded from the model. 2. Other marital status includes, separated, divorced and widowed. Note: Excludes data from the Northwest Territories, Yukon and Nunavut which will be published at a later date. Based on non-spousal violent incidents that occurred during the 12 months preceding the survey. Source: Statistics Canada, General Social Survey, 2009. | |
A second logistical regression was performed to determine whether the same risk factors were involved for Aboriginal people. It showed that age, drug use, activity limitations and people using or selling drugs in the neighbourhood were the major risk factors.
| Independent variables | Odds ratio |
|---|---|
| Age | |
Aged 45 and over | reference |
15 to 24 | 4.8*** |
25 to 34 | 1.5 |
35 to 44 | 2.9*** |
| Activity limitation | |
No limitation | reference |
Limited in activities | 1.9* |
| Use of drugs | |
Don't uses drugs daily | reference |
Use drugs daily | 2.7*** |
| People using or dealing drugs in the neighbourhood? | |
No | reference |
Yes | 1.7* |
| * Significant at p < 0.05 *** Significant at p < 0.001 Note: Excludes data from the Northwest Territories, Yukon and Nunavut which will be published at a later date. Based on non-spousal violent incidents that occurred during the 12 months preceding the survey. Source: Statistics Canada, General Social Survey, 2009. | |
Methodology for the General Social Survey on Victimization
In 2009, Statistics Canada conducted the victimization cycle of the General Social Survey for the fifth time. Previous cycles were conducted in 1988, 1993, 1999 and 2004. The objectives of the survey are to provide estimates of Canadians' personal experiences of eight offence types, examine risk factors associated with victimization, examine reporting rates to police, measure the nature and extent of spousal violence, measure fear of crime and examine public perceptions of crime and the criminal justice system.
Sampling
The target population included all persons 15 years and older in the 10 Canadian provinces, excluding full-time residents of institutions. The survey was also conducted in the three Canadian territories using a different sampling design and its results will be available in a separate report to be released in 2011. Households were selected by a telephone sampling method called Random Digit Dialling (RDD). Households without telephones or with only cellular phone service were excluded. These two groups combined represented approximately 9% of the target population (Residential Telephone Service Survey, (RTSS), December 2008). The coverage, therefore, for 2009 was 91%.
Once a household was contacted, an individual 15 years or older was randomly selected to respond to the survey. The sample in 2009 was approximately 19,500 households, a smaller sample than in 2004 (24,000).
Data collection
Data collection took place from February to November 2009 inclusively. The sample was evenly distributed over the 10 months to represent seasonal variation in the information. A standard questionnaire was administered by telephone using computer-assisted telephone interviewing (CATI). A typical interview lasted 45 minutes. Prior to collection, all GSS questions went through qualitative and pilot testing.
Response rates
Of the 31,510 households that were selected for the GSS Cycle 23 sample, 19,422 usable responses were obtained. This represents a response rate of 61.6%. Types of non-response included respondents who refused to participate, could not be reached, or could not speak English or French. Respondents in the sample were weighted so that their responses represent the non-institutionalized Canadian population aged 15 years or over, in the ten provinces. Each person who responded to the 2009 GSS represented roughly 1,400 people in the Canadian population aged 15 years and over.
Data limitations
As with any household survey, there are some data limitations. The results are based on a sample and are therefore subject to sampling error. Somewhat different results might have been obtained if the entire population had been surveyed. This Juristat uses the coefficient of variation (CV) as a measure of the sampling error. Any estimate that has a high CV (over 33.3%) has not been published because the estimate is too unreliable. In these cases, the symbol 'F' is used in place of an estimate in the figures and data tables. An estimate that has a CV between 16.6 and 33.3 should be used with caution and the symbol 'E' is referenced with the estimate. Where descriptive statistics and cross-tabular analysis were used, statistically significant differences were determined using 95% confidence intervals.
Using the 2009 GSS sample design and sample size, an estimate of a given proportion of the total population, expressed as a percentage is expected to be within 0.95 percentage points of the true proportion 19 times out of 20.
Notes
E use with caution
- Information on victimization in the territories was collected using a different methodology and results will be published at a later date.
- The question used to identify the Aboriginal population in the 2009 GSS on Victimization was changed from previous cycles to coincide with the question used in the 2006 Census. As such, the 2009 results for the Aboriginal population cannot be directly compared to those from previous victimization cycles. Households in the ten provinces were selected for the GSS survey by a sampling method called Random Digit Dialing (RDD) and respondents were interviewed by telephone. It should be noted that the proportion of households with a landline telephone may be relatively low on some Indian reserves and settlements (Brzozowski and Mihorean, 2002).
- This report was funded by the Policy Centre for Victim Issues (PCVI) of the Department of Justice Canada.
- Figures for robbery were too small to be published.
- For further information, see Models 1 and 2 in the section "Methodology for the multivariate analysis" at the end of this report.
- For further information, see Model 1 in the section "Methodology for the multivariate analysis" at the end of this report.
- In 2009, the data on perpetrators and the presence of a weapon were based on 69% of violent incidents.
- A census metropolitan area (CMA) consists of one or more neighbouring municipalities situated around an urban core. A CMA must have a total population of at least 100,000 of which 50,000 or more live in the urban core. To be included in the CMA, other adjacent municipalities must have a high degree of integration with the central core, as measured by commuting flows derived from census data.
- 63% of Aboriginal victims of violence by an ex-spouse shared at least one child with that ex-spouse.
- Date modified: