|
||||||
Information identified as archived is provided for reference, research or recordkeeping purposes. It is not subject to the Government of Canada Web Standards and has not been altered or updated since it was archived. Please "contact us" to request a format other than those available.
|
|
FindingsWhat are the differences between male and female self-reported offending in Canada?
What are the differences between male and female self-reported offending in Canada?The first aim of this study is to describe sex differences in delinquent behaviour. NLSCY data show that females aged 12 to 15 years report lower rates of delinquency than do males for each of the property-related and violent acts. These findings are consistent with police-reported data from Canada, and with self-report data from other countries such as the United Kingdom and the United States (Huizinga et al. 1995; Kempf-Leonard et al. 2001; Espiritu et al. 2001; Baker 1998). Table 1 shows male/female differences in estimates for both the nature and extent of delinquent acts. While roughly equal proportions of males reported committing violent (29.2%) and property-related (29.3%) delinquency, far fewer females reported similar behaviours. Fewer than 20% reported participating in property-related acts and about half as many (10%) reported involvement in violent acts. In addition, when females did report delinquent behaviour, the nature of the act was different than for males. Overall, females more frequently committed the less serious forms of delinquency measured in the NLSCY. For instance, with respect to property, males report the more minor act of stealing from a store or school 1.4 times more often than females, but that ratio increases to about 2.5 to 3 times for more serious acts such as using, buying or selling stolen goods (fencing), stealing a vehicle, or arson. This pattern is similar for violent delinquency. For all violent acts, the male to female ratio is roughly 3 to 1. Being in a fight that caused injuries was the most frequently reported violent act for both males (15%) and females (5%). Less common were acts such as carrying various weapons for defence, fighting with a weapon and threatening someone to get their money or property.
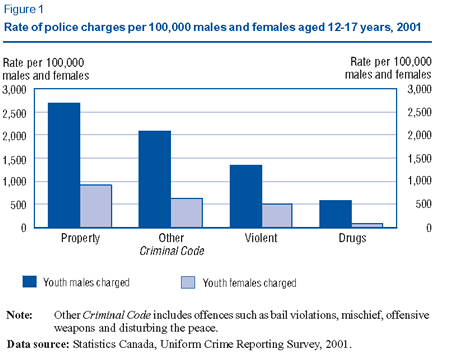
Police reported rates of youth crime As is the case with the self-reported data used in this study, police reports show that the majority of Canadian youths involved in crime are male. In 2001, the ratio of male to female youth charged for all offences was roughly 3 to 1. Figure 1 shows that males are charged at a greater rate than are females across all offence categories.
Are males and females differently exposed to low school commitment and victimization?The remaining tables and figures all bear on the second research question in this study, which is to test whether there are factors that explain differences in male and female delinquency patterns. To begin with, Table 2 shows male and female mean scores for the two factors of interest: school commitment and victimization. Keeping in mind that the lowest school commitment scores indicate the highest level of commitment, the table shows that the mean score for females (4.72) was significantly lower than for males (5.46). Thus, on average females were more committed to school than were males. With respect to the victimization scale, where a low score indicated the lowest levels of victimization, the mean score for females (0.57) was significantly lower than for males (1.18). On average, males in the sample reported higher levels of victimization than did females. In fact, about 48% of males reported being victimized at least once in the past year compared to about 28% of females. It should be noted that the non-specific nature of the NLSCY victimization questions may lead to an undercounting of the prevalence of victimization, and in particular of sexual assaults, which may have greater consequences for female youth since other data sources indicate that females report experiencing higher levels of sexual assault than do males (Kong, Johnson, Beattie and Cardillo 2003). However, the higher level of victimization among males in the NLSCY sample is consistent with results from other household surveys of youth that focus specifically on injury sustained from assaults or robbery (Loeber, Kalb and Huizinga 2001). What is an odds ratio?When an outcome variable for a regression model is dichotomous, for example, committing a delinquent act versus not committing a delinquent act, researchers are interested in determining the probability of the occurrence of that event under a particular set of circumstances, for example, having low income, being female, or living in a single parent family. In this case logistic regression is the most appropriate technique to use. An odds ratio is a statistic generated by a logistic regression and can be used to assess whether, other things being equal, youth with specific characteristics are more or less likely to engage in delinquent behaviour than those in another group, referred to as the reference category. For example, consider the risk of delinquency for youth with a low level of income adequacy compared to those with an average level (the reference category). An odds ratio near 1.0 implies there is no difference in delinquency between the two groups; an odds ratio less than 1.0 implies those in the group being considered (i.e. youth with a low level of income adequacy) are less likely to be delinquent than those in the reference group (i.e. youth with an average level of income adequacy) and an odds ratio greater than 1.0 implies those in the group being considered are more likely to be delinquent than those in the reference category. When an explanatory variable is continuous (e.g. age measured in years), the odds ratio indicates how many times the ratio P/(1-P) is greater or smaller for a one unit increase of this variable (e.g., for an individual who is one year older, than another individual). For example, an odds ratio of 2.0 indicates that the odds of delinquent behaviour are twice as high for a 12 year old as they are for an 11 year old. Are males and females affected differently by their commitment to school?Table 3 displays the partial odds ratios associated with the main effects for sex and school commitment, the interaction between sex and school commitment, and the set of socio-economic and demographic control variables, after controlling for the other variables in the model. The two models in the table estimate the likelihood of committing property-related and violent delinquency separately. Model 1 shows significant odds ratios for the main effects of sex and school commitment as well as for the interaction term (sex x school commitment) indicating that the effect of school commitment is significantly different for males and females. The same result does not exist for violent offences (Model 2), where the main effects for sex and school commitment are significant, but the interaction term is not. This finding is supported by Sprott, Jenkins and Doob (2000) who found sex differences with respect to the protective effect of school attachment on property-related delinquency, particularly in the face of multiple risk factors, but did not find the same differences for violent offences. Similarly, Mears et al. (1998) found sex differences with respect to the protective effect of moral attitudes on property offences, specifically minor theft, but no such differences were reported for violent offences. The different results for property and violent delinquency in the NLSCY 12-15 year old sample, support the notion that there may be different catalysts for those involved in violent and property-related delinquency (Sprott, Jenkins and Doob 2000; Moffit 1993).
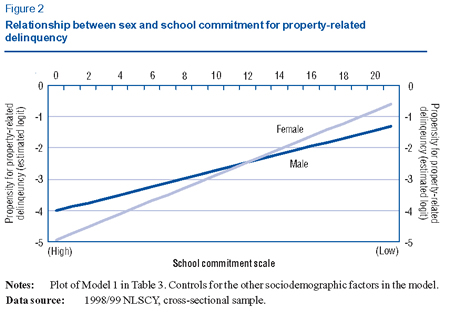
In order to assist in visualizing the interaction effect between sex and school commitment for property-related delinquency, Figure 2 shows a plot of the first model from Table 3. The lines correspond to the estimated log odds for males and females, and illustrate the sex differences in the propensity to commit property-related delinquency according to the level of commitment to school (controlling for the other independent variables in the model). While the slopes indicate that school is important for both sexes, the steeper line for females suggests that a strong commitment to school acts as a greater barrier to property-related delinquency than it does for males. When school commitment is at its lowest, 21 on the scale, the likelihood for involvement in property-related delinquency is greater among females than males. In contrast, at the highest levels of commitment to school, 0 on the scale, the propensity for involvement in property offences is lower for females than for males. Another way of interpreting the results in Figure 2 is by calculating the probability of delinquency (exp(logit)/(1+exp(logit))) at the highest and lowest levels of school commitment. This exercise shows that after controlling for other factors in the model, at the lowest level of school commitment (21 on the scale) a female would have a 36% chance of committing a property-related delinquent act, while a male would have a 21% chance. However, at the highest level of school commitment (0), males and females have similar and very low chances of committing these acts (1% and 2%, respectively). Thus, the first model in Table 3 and the plot in Figure 2 show that school commitment influences the likelihood of involvement in property-related delinquent behaviour for both sexes. Other factors being equal, as the level of commitment to school increases, the likelihood of property-related delinquency decreases. The results also point to sex differences in this relationship, since females in particular have greater chances of engaging in property-related delinquency when they have the lowest commitment to school.
Are males and females affected differently by experiences of victimization?Evidence related to this question appears in Table 4, which displays the odds ratios associated with the main effects for sex and victimization, the interaction between sex and victimization, and the set of socio-economic and demographic control variables. The two separate models in the table estimate the likelihood of committing either property-related or violent delinquency. Both models display significant odds ratios for the interaction term (sex x victimization) indicating that males and females are affected differently by victimization.
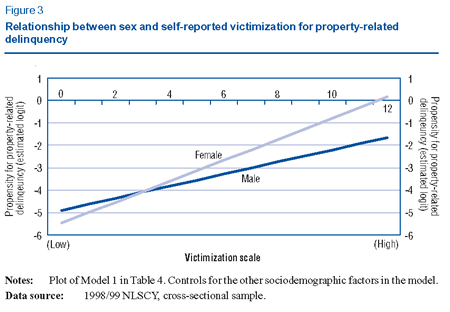
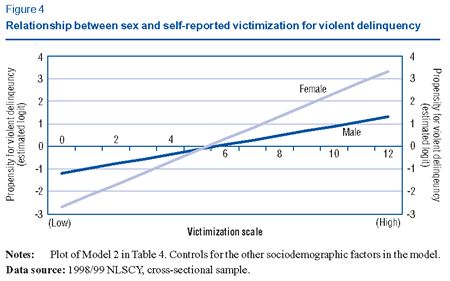
Figures 3 and 4 provide visual representations of the models from Table 4. Once again, the plotted lines correspond to the estimated log odds for males and females, and illustrate the sex differences in the propensity to commit both violent and property-related delinquency according to the level of self-reported victimization (controlling for the other independent variables in the model). For both types of delinquency, females are most affected at the highest levels of self-reported victimization, showing higher odds of delinquency than males at the high end of the victimization scale (12). When victimization is at its lowest level, 0 or none, the female odds for delinquency drop below those for males. An examination of the probability of property-related delinquent behaviour, (exp(logit)/(1+exp(logit))), reveals that at the highest level of victimization (12) a female would have a 53% chance of committing a property-related delinquent act, while a male would have about a 16% chance, and at the lowest level of victimization (0), males and females have roughly similar chances at 1% and less than 1%, respectively. Now considering the probabilities for violent delinquency, when an individual has experienced the greatest level of victimization, the probability of also committing a violent act is higher for both sexes. However, this is particularly the case for females who experience an over 90% chance of committing a violent act compared to males with a 79% chance. The plots in Figures 3 and 4 make it possible to visualize the relationship between victimization and delinquency for 12-15 year olds in the NLSCY sample. After controlling for the other variables in the models, one can see that as the level of victimization increases, levels of property-related and violent delinquency also increase. While the direction of this relationship is consistent for males and females, the data indicate that there are some differences between the sexes. At the highest levels of victimization, females exhibit greater chances of engaging in both forms of delinquency, than is the case for males.
|
||||||||||||||||||||||||||||||||||||||||||||||||||||||||||||||||||||||||||||||||||||||||||||||||||||||||||||||||||||||||||||||||||||||||||||||||||||||||||||||||||||||||||||||||||||||||||||||||||||||||||||||||||||||||||||||||||||||||||||||||||||||||||||||||||||||||||||||||||||||||||||||||||||||||||||||||||||||||||||||||||||||||||||||||||||||||||||||||||||||||||||||
|