
Chart 4
Proportion of the female population composed of seniors aged 65 and over, by broad age group, Canada, provinces and territories, 2031
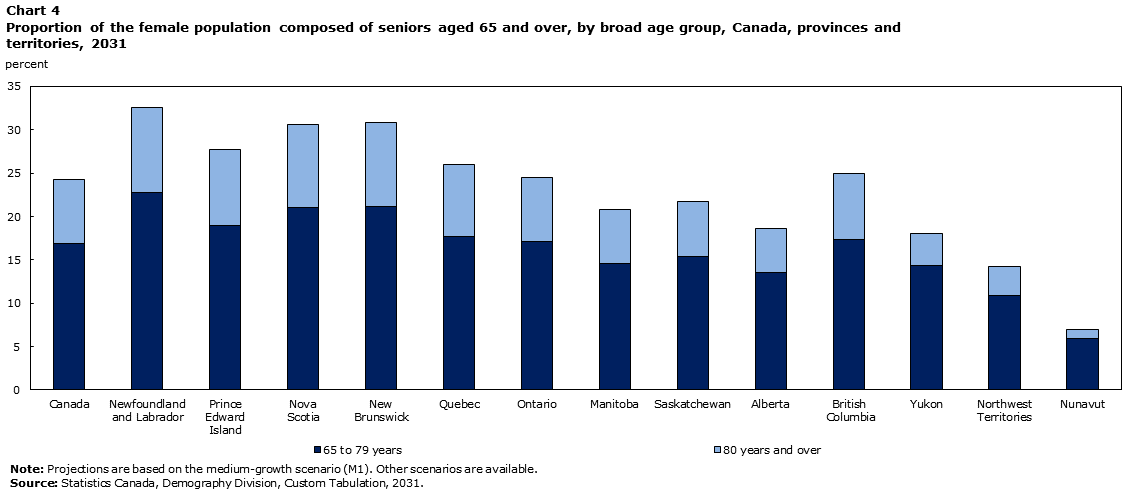
Description for Chart 4
| 65 to 79 years | 80 years and over | |
|---|---|---|
| Canada | 16.9 | 7.4 |
| Newfoundlandand Labrador | 22.8 | 9.8 |
| Prince EdwardIsland | 19.0 | 8.7 |
| NovaScotia | 21.1 | 9.5 |
| New Brunswick | 21.2 | 9.6 |
| Quebec | 17.7 | 8.3 |
| Ontario | 17.1 | 7.4 |
| Manitoba | 14.6 | 6.2 |
| Saskatchewan | 15.4 | 6.3 |
| Alberta | 13.5 | 5.1 |
| British Columbia | 17.3 | 7.7 |
| Yukon | 14.3 | 3.7 |
| Northwest Territories | 10.9 | 3.3 |
| Nunavut | 5.9 | 1.1 |
Note:
Projections are based on the medium-growth scenario (M1). Other scenarios are available.
Source:
Statistics Canada, Demography Division, Custom Tabulation, 2031.
- Date modified: