
Chart 13
Proportion of children aged 1 to 9 years in regular child care, by age group and sex, Canada, 2010
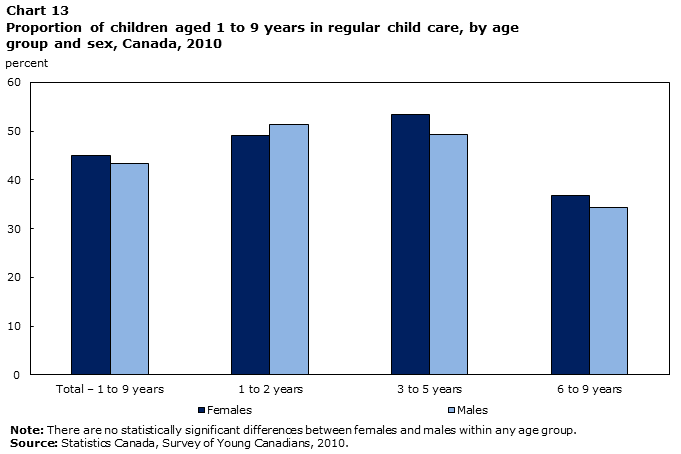
Data table for Chart 13
| Total – 1 to 9 years | 1 to 2 years | 3 to 5 years | 6 to 9 years | |
|---|---|---|---|---|
| percent | ||||
| Females | 45.0 | 49.1 | 53.3 | 36.8 |
| Males | 43.3 | 51.3 | 49.3 | 34.4 |
|
Note: There are no statistically significant differences between females and males within any age group. Source: Statistics Canada, Survey of Young Canadians, 2010. |
||||
- Date modified: