
Chart 14
Rates of adult males charged by police, by offence category, 1998 to 2015
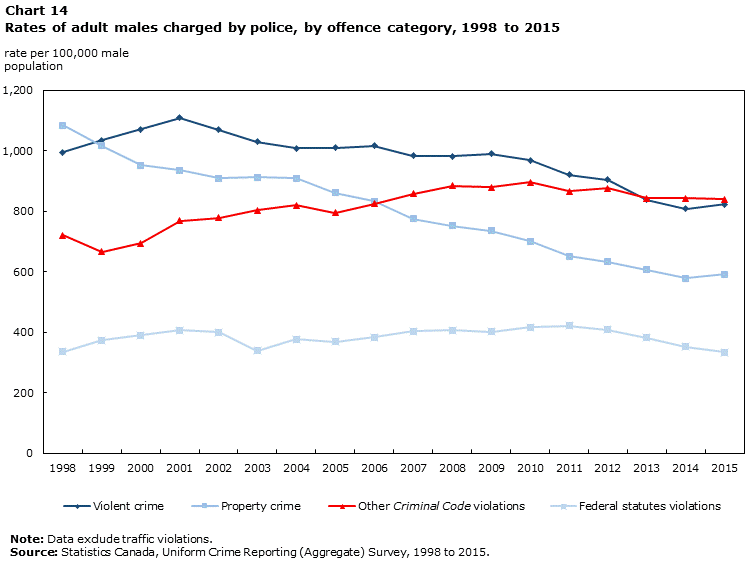
Data table for Chart 14
| Year | Violent crime | Property crime | Other Criminal Code violations | Federal statutes violations |
|---|---|---|---|---|
| rate per 100,000 male population | ||||
| 1998 | 995.3 | 1085.1 | 721.4 | 335.3 |
| 1999 | 1034.3 | 1016.2 | 666.9 | 373.4 |
| 2000 | 1071.3 | 951.7 | 694.1 | 391.0 |
| 2001 | 1109.4 | 935.3 | 769.1 | 407.2 |
| 2002 | 1069.5 | 909.5 | 779.3 | 399.8 |
| 2003 | 1030.9 | 913.2 | 803.5 | 338.9 |
| 2004 | 1007.9 | 909.8 | 820.7 | 377.6 |
| 2005 | 1011.0 | 861.8 | 795.4 | 369.4 |
| 2006 | 1017.0 | 833.2 | 825.9 | 384.5 |
| 2007 | 983.4 | 776.3 | 858.6 | 402.9 |
| 2008 | 981.7 | 752.4 | 884.7 | 406.8 |
| 2009 | 989.9 | 736.4 | 879.7 | 401.8 |
| 2010 | 968.6 | 700.5 | 896.5 | 417.7 |
| 2011 | 920.8 | 652.0 | 866.8 | 421.7 |
| 2012 | 904.1 | 633.1 | 876.3 | 408.0 |
| 2013 | 838.3 | 607.0 | 843.6 | 382.5 |
| 2014 | 808.3 | 578.6 | 842.6 | 352.8 |
| 2015 | 823.2 | 592.9 | 840.4 | 334.9 |
|
Note: Data exclude traffic violations. Source: Statistics Canada, Uniform Crime Reporting (Aggregate) Survey, 1998 to 2015. |
||||
- Date modified: