Employment

Archived Content
Information identified as archived is provided for reference, research or recordkeeping purposes. It is not subject to the Government of Canada Web Standards and has not been altered or updated since it was archived. Please "contact us" to request a format other than those available.
- Employment rates
- Labour force status
- Most common reasons for not finding a job
- Employment by industry
Employment rates
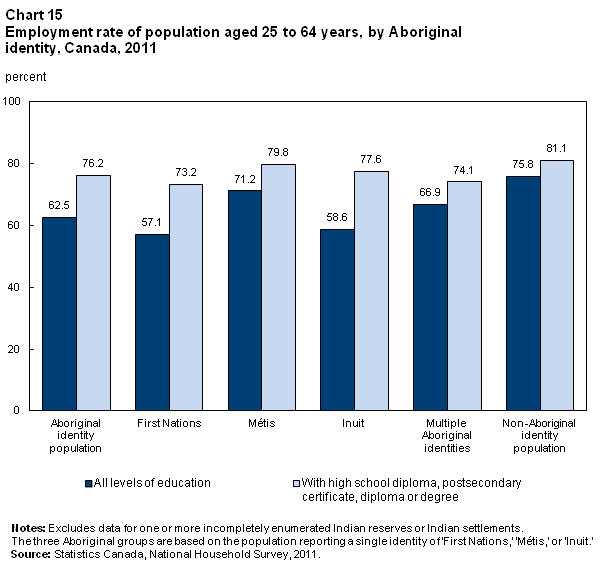
Aboriginal people less likely to be employed than their non-Aboriginal counterparts
The 2011 National Household Survey shows an employment rate of 62.5 % among Aboriginal people of core working age (aged 25 to 64 ). The comparable rate for non-Aboriginal people is 75.8 %.
The employment rate was 57.1% for First Nations people aged 25 to 64, which is similar to the employment rate for Inuit (58.6%) and lower than the employment rate for Métis (71.2%) in that age group.
Although Aboriginal people are still less likely than non-Aboriginal people to be employed, the employment rate gap for those with a high school diploma, or with a postsecondary certificate, diploma or degree is less than that for all levels of education. A gap of 5 percentage points exists between the employment rates of Aboriginal people (76.2%) and of the non-Aboriginal population (81.1%) for those with a high school diploma and a postsecondary certificate, diploma or degree, compared to a gap of 13 percentage points (62.5% versus 75.8%) when all levels of education are accounted for.
For additional information, see 2011 National Household Survey: Data tables.
Labour force status
| Labour force status | Off-reserve First Nations people | Métis | Inuit | |||
|---|---|---|---|---|---|---|
| completersNote with dagger for table 4† | leavers | completersNote with dagger for table 4† | leavers | completersNote with dagger for table 4† | leavers | |
| percent | ||||||
| Employed | 72 | 47Note with asterisk for table 4* | 80 | 61Note with asterisk for table 4* | 71 | 44Note with asterisk for table 4* |
| Unemployed | 9 | 15Note with asterisk for table 4* | 6 | 11Note with asterisk for table 4* | 9 | 17Note with asterisk for table 4* |
| Not in labour force | 20 | 37Note with asterisk for table 4* | 14 | 28Note with asterisk for table 4* | 20 | 39Note with asterisk for table 4* |
Source: Statistics Canada, Aboriginal Peoples Survey, 2012. |
||||||
High school completers more likely to be employed
The 2012 Aboriginal Peoples Survey (APS) shows that nearly 3 out of 4 (72%) off-reserve First Nations people aged 18 to 44 years who had completed high school (completers) had a job, that 9% among this group were unemployed and looking for work, and that 20% were not in the labour force (neither working nor looking for work). Among Métis high school completers aged 18 to 44 years, 80% had a job, 6% were unemployed and looking for work, and 14% were not in the labour force. In this same age group, 7 in 10 (71%) Inuit completers had a job, while 9% were unemployed and looking for work, and 20% were not in the labour force.
The labour force profile of high school leavers was different. Among First Nations leavers, results were the following: 47% were employed; 15% were unemployed; and 37% were not in the labour force. The situation was similar for Inuit leavers: 44% were employed; 17% were unemployed; and 39% were not in the labour force. However, among Métis leavers, a higher proportion (61%) were employed, and fewer were unemployed (11%) or not in the labour force (28%).
For additional information, see The Education and Employment Experiences of First Nations People Living Off Reserve, Inuit, and Métis: Selected Findings from the 2012 Aboriginal Peoples Survey.
Most common reasons for not finding a job
| Selected reasons for not finding work | Off-reserve First Nations people | Métis | Inuit | |||
|---|---|---|---|---|---|---|
| completersNote with dagger for table 5† | leavers | completersNote with dagger for table 5† | leavers | completersNote with dagger for table 5† | leavers | |
| percent | ||||||
| Shortage of work | 57 | 64 | 55 | 54 | 69 | 85 |
| Work inexperience | 52 | 65 | 54 | 63 | 40 | 62Note with asterisk for table 5* |
| Lack of education/training | 38 | 69Note with asterisk for table 5* | 45 | 72Note with asterisk for table 5* | 37 | 69Note with asterisk for table 5* |
Percentages do not add up because respondents could choose more than one answer. Source: Statistics Canada, Aboriginal Peoples Survey, 2012. |
||||||
Most common reasons for not finding work: shortage of jobs, lacking the necessary work experience and not having the necessary training and education
Other reasons cited as barriers to finding work include the following: 39% of off-reserve First Nations people reported not having transportation ; 41% of Inuit cited not knowing where to look; and 32% of Métis reported not knowing what type of job they wanted.
For all three Aboriginal groups, leavers were more likely than completers to say that they did not have the appropriate education or training.
For additional information, see The Education and Employment Experiences of First Nations People Living Off Reserve, Inuit, and Métis: Selected Findings from the 2012 Aboriginal Peoples Survey.
Employment by industry
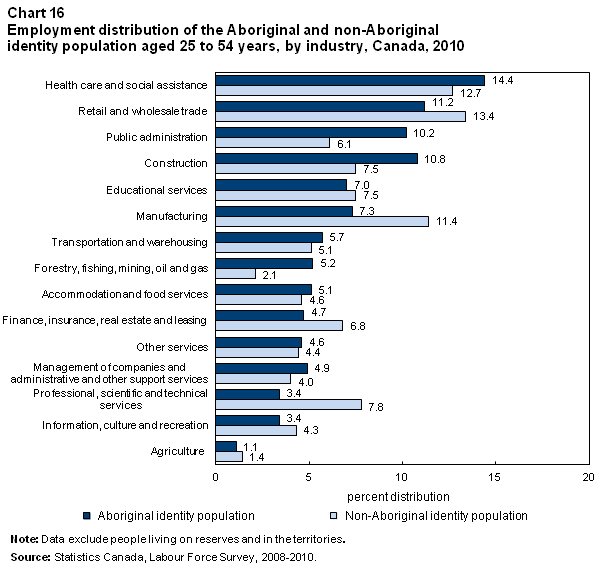
Aboriginal and non-Aboriginal workers concentrated in different industries
The Labour Force Survey (which excludes people living on reserves and in the territories) shows that, in 2010, Aboriginal people were more likely to be employed in public administration; construction; forestry, fishing, mining, oil and gas; and health care and social assistance than their non-Aboriginal counterparts.
The representation of non-Aboriginal people was higher in professional, scientific and technical services; finance, insurance, real estate and leasing; manufacturing; and retail and wholesale trade for the core working age group of 25 to 54 years.
For additional information, see Aboriginal People and the Labour Market: Estimates from the Labour Force Survey, 2008-2010.
- Date modified: