
Publications
Canadian Survey on Disability, 2012
Memory disabilities among Canadians aged 15 years and older, 2012
Memory disabilities among Canadians aged 15 years and older, 2012

Archived Content
Information identified as archived is provided for reference, research or recordkeeping purposes. It is not subject to the Government of Canada Web Standards and has not been altered or updated since it was archived. Please "contact us" to request a format other than those available.
by Carley Marshall, Christine Bizier, Sabrina Gilbert and Gail Fawcett
The results presented in this fact sheet are from the 2012 Canadian Survey on Disability (CSD), which surveyed residents of private dwellings who reported an activity limitation and who were aged 15 years and older at the time of the 2011 National Household Survey (NHS).
According to the CSD, respondents are considered to have a disability not only if they report a difficulty or impairment due to a long-term condition or health problem, but also if they report that they are limited in their daily activities as a result of their condition. Appendix A describes how the CSD defines memory disabilities.
It should be noted that the population living in institutions, including residential care facilities, was not included in the 2012 CSD. Further details are available in the Canadian Survey on Disability, 2012: Concepts and Methods Guide.
According to the 2012 Canadian Survey on Disability (CSD), 3,775,900 (13.7%) adult Canadians aged 15 years and older reported some type of disability, and 628,200 (2.3% of Canadian adults) were identified as having a memory disability.Note 1
| Disability type | Population | Percentage |
|---|---|---|
| Total disability | 3,775,900 | 13.7 |
| Pain-related | 2,664,200 | 9.7 |
| Flexibility | 2,078,000 | 7.6 |
| Mobility | 1,971,800 | 7.2 |
| Mental health-related | 1,059,600 | 3.9 |
| Dexterity | 953,100 | 3.5 |
| Hearing | 874,600 | 3.2 |
| Seeing | 756,300 | 2.8 |
| Memory | 628,200 | 2.3 |
| Learning | 622,300 | 2.3 |
| Developmental | 160,500 | 0.6 |
| Unknown | 79,500 | 0.3 |
| Note: Individuals may have more than one type of disability; therefore, the sum of all individual disability types is greater than the number of "total disabilities". Source: Statistics Canada, Canadian Survey on Disability, 2012. |
||
The most prevalent underlying memory-related conditions reported were Alzheimer’s, dementia, and amnesia; however, a substantial number of people listed other underlying conditions such as: fibromyalgia, stroke, brain injury, multiple sclerosis, learning disabilities, developmental disabilities, mental health-related issues, Parkinson’s, epilepsy, arthritis, heart disease, and back pain. Some of these conditions are often accompanied by memory-related issues. As well, medication often taken for some of these conditions can also lead to problems with memory (for example: some anti-depressants, some anti-seizure drugs, some narcotic painkillers, some Parkinson’s medication, some cholesterol lowering drugs, some hypertension medication, and some incontinence drugs) (National Institute on Aging, 2010).Note 2
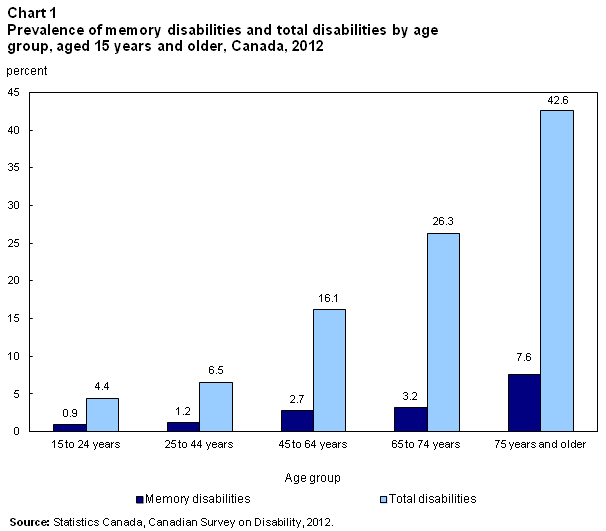
As with disability in general, the likelihood of having a memory disability increased notably with age—ranging from a prevalence of 0.9% among those aged 15 to 24 to 7.6% among those aged 75 and older.Note 3 In fact, the prevalence of memory disabilities among those aged 75 and older (7.6%) was more than double that of those aged 65 to 74 (3.2%) (Chart 1).
The prevalence of memory disabilities was only slightly higher among women than men aged 25 to 44 (1.4% versus 1.0%) and aged 45 to 64 (3.2% versus 2.3%). In the oldest and youngest age groups, gender differences in prevalence were not statistically significant.
Multiple disabilities
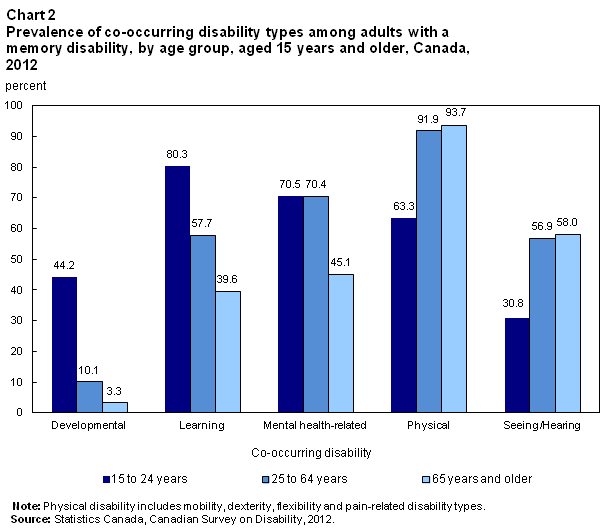
Almost everyone with a memory disability (98.3%) reported having at least one other type of disability, the highest rate of co-occurrence of any of the disability types. More than half of those with a memory disability also had five or more additional types of disabilities. This is consistent with the literature on dementia which documents a range of other physical and non-physical health conditions among those with serious memory problems.Note 4
The pattern of co-occurrence varied by age and by the nature of the co-occurring disability type. For example, young adults, aged 15 to 24, with a memory disability were more likely to also have had either a developmental disability (44.2%) or a learning disability (80.3%) than those aged 25 and older. This suggests strong links among memory, developmental, and learning disabilities for younger adults in particular. As well, over 70% of those younger than age 65 with a memory disability also had a mental health-related disability (Chart 2).
Overall, the highest rates of co-occurrence for those with a memory disability involved physical disabilities—particularly among adults aged 25 to 64 and those aged 65 and older, among whom over 90% also had some type of physical disability.
Education
Educational attainment
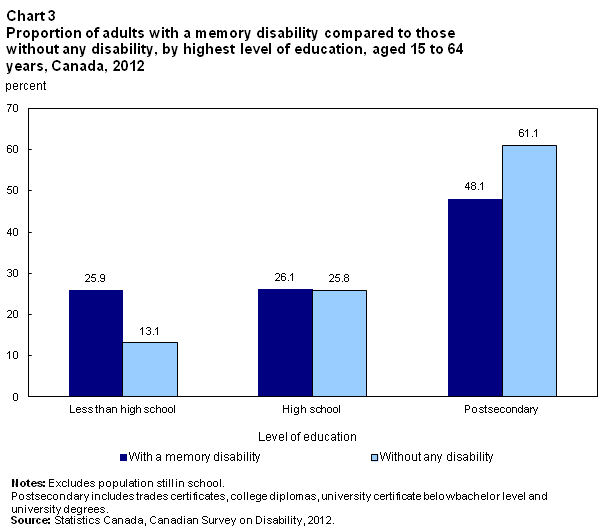
Working-age adults (aged 15 to 64) with a memory disability had lower levels of educational attainment than adults without disabilities. Among those who were not still in school, adults with a memory disability were more likely than those without any disability to have not completed high school (25.9% versus 13.1%) regardless of age. Conversely, those without any disability were more likely than those with a memory disability (61.1% versus 48.1%) to have completed postsecondary credentials (Chart 3), and this was true within every age group.Note 5 There were no significant gender differences in the rate of not completing high school or in the rate of obtaining postsecondary credentials among those with a memory disability.
Educational experiences
Adults with a disability who were currently or had recently been in school were asked a series of questions about their educational experiences and how their condition or conditions may have affected these experiences.Note 6 Nearly two-thirds of adults with a memory disability reported that their condition(s) had influenced their choice of courses or careers and resulted in them taking fewer courses.
Employment
Labour force status
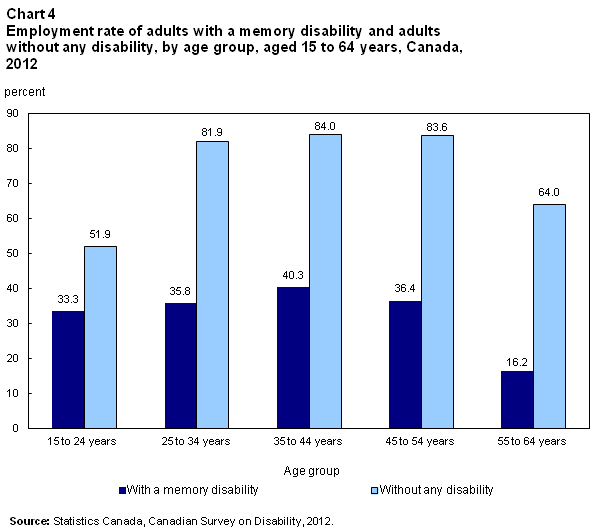
The majority (62.1%) of adults aged 15 to 64 with a memory disability were not in the labour force and another 7.2% were unemployed. The employment rate for working age adults with a memory disability was less than half that for people without disabilities (30.7% versus 73.6%). There were no statistically significant differences in employment rates between men and women with memory disabilities regardless of age.
The difference was particularly pronounced among older working-age adults, aged 55 to 64, among whom those without any disability were four times more likely to be employed than those with a memory disability (Chart 4).
Disability in the workplace
Over a third (36.7%) of employed adults with a memory disability indicated that their employer was unaware of their condition(s). Among those who were currently in the labour market or had been within the previous five years, 71.4% reported that they felt disadvantaged in employment and 70.8% believed that their employer considered them disadvantaged in employment. More specifically, 21.2% believed that they had been refused a job, 19.7% felt they had been refused a promotion, and 16.3% believed that they had been refused a job interview because of their disability or disabilities. It is important to remember that this is based on the impact of all disability types these individuals with a memory disability may have had.
Job modifications
Among adults with a memory disability who were currently in the labour force or had been within the previous five years, 59.5% reported needing at least one type of job accommodation such as modified work hours (40.5%) or modified duties (24.9%). Of those requiring modifications, 45.1% reported that all their needs had been met, while 26.2% indicated having had only some needs met. The remaining 28.6% reported that none of their needs had been met. Given the high prevalence of co-occurrence with other types of disabilities, some of these accommodations may have not been for memory disabilities.
Hours worked
Employed working-age adults, aged 15 to 64, with a memory disability worked an average of 31 hours per weekNote 7, less than the average number of hours worked per week by those without any reported type of disability (37 hours).
Not in the labour force
Among those with a memory disability aged 15 to 64 who were not in the labour force, 79.7% reported that their condition prevented them from working. Of these, 19.1% indicated that there was some type of accommodation that would allow them to work. As well, 26.1% indicated that they would look for work in the next 12 monthsNote 8. Respondents who planned to look for work were asked why they intended to do so:
- 36.7% expected their condition to improve,
- 18.5% expected workplace changes/improvements, and
- 14.8% planned to take training.
Many who were not in the labour force reported barriers that discouraged them from looking for work. Some of the most commonly reported job search barriers for those with a memory disability were lack of available local jobs (31.1%), inadequate training or experience (28.4%), unsuccessful past attempts (24.6%), and a fear of losing additional supports (23.2%).
Supports
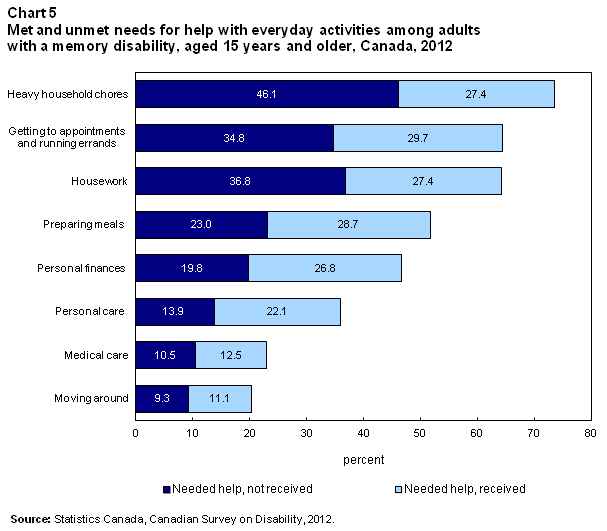
Overall, nine in ten adults with a memory disability indicated that they required help with some type of everyday activity and nearly three-quarters of these reported having some level of unmet need for at least one of these support requirements. Nearly all (97.7%) of those aged 75 and older had a requirement for help with at least one everyday activity. The prevalence of those who required assistance with everyday activities did not differ significantly among the other age groups.
While 83.6% of all adults with a memory disability reported receiving help with at least one type of everyday activity, there was unmet need for various specific types of supports as summarized in Chart 5. For example, 46.1% of all adults with a memory disability had an unmet need for help with heavy household chores; while 9.3% had an unmet need for help with moving around.
Help with everyday activities was most likely to have come from family members, particularly those in the same household. For example, among those receiving assistance with such activities, 72.5% of those with a memory disability received some help from family members living with them and 43.1% received some help from family members not living with them. As well, among those with a memory disability who received some assistance, 26.2% received help from a friend or neighbour, 18.7% from an organization free of charge, and 19.5% paid an individual or organization for help. Among those with a memory disability, seniors were more likely than working-age individuals to have received help from an organization for free (23.7% versus 15.8%) and to have paid for such assistance (26.3% versus 15.5%).
Income
Personal income for working-age adults
The median personal income (before taxes) of working-age adults, aged 15 to 64 years, with a memory disability was $14,500—less than half that of those without disabilities ($31,200).Note 9 Those with a memory disability were also more likely to be reliant on government transfersNote 10 as their major source of income compared with those without disabilities; for example, 63.0% of working-age adults with a memory disability relied on government transfers as their largest source of incomeNote 11 compared with 18.7% of those without disabilities. Among those who had some income from employment, those with a memory disability had lower median employment incomesNote 12 than those without disabilities ($15,900 compared with $34,100).
Conclusion
According to the 2012 CSD, the prevalence of memory disabilities increased with age, particularly after 75. Almost all adults with a memory disability had another type of disability; in fact, over half of this population reported five or more other types of disabilities. Given the complex interplay of disabilities in this population, it is not surprising that their levels of education, rates of employment, and income were lower than those of adults without any disability. Nine in ten adults with a memory disability needed help with everyday activities, and close to three-quarters of them reported at least one type of unmet need. While most of the help received by this population came from family members, particularly those in the same household, assistance with everyday activities often came from multiple other sources, with one in five paying for at least some of the assistance they received.
Appendix A
Identification of adults with a memory disability
The 2012 Canadian Survey on Disability (CSD) identified adults with a memory disability as those whose daily activities were limited because of difficulties caused by memory problems. The survey used the newly developed Disability Screening Questions (DSQ) to identify disability. The initial step involved in identifying a memory disability was to establish the existence of a memory problem:
DSQ_35 Do you have any ongoing memory problems or periods of confusion? Please exclude occasional forgetfulness such as not remembering where you put your keys.
For those who said yes and indicated having such a memory problem, another question was asked to determine if the problem limited their daily activities:
DSQ_36 How often are your daily activities limited by this problem?
- Never
- Rarely
- Sometimes
- Often
- Always
Those who reported being limited at least rarely were asked a follow-up question to determine the degree of difficulty:
DSQ_37 How much difficulty do you have with your daily activities because of this problem?
- No difficulty
- Some difficulty
- A lot of difficulty
- You cannot do most activities
A memory disability was identified when respondents reported being limited at least sometimes regardless of degree of difficulty. As well, those who reported being limited only rarely, were considered to have a memory disability if they also indicated having a lot of difficulty or being unable to do most activities when being limited.
An estimated 903,700 Canadian adults reported having a memory problem. Of these, 628,200 (2.3%) Canadian adults were identified as having a memory disability based on the methodology described above.
References
BMC Psychiatry. 2014. Comorbidity of dementia: a cross-sectional study of primary care older patients. Available at: http://www.biomedcentral.com/1471-244X/14/84 or http://www.ncbi.nlm.nih.gov/pmc/articles/PMC3994526/. Accessed November 20, 2014.
Dementia Collaborative Research Centres, an Australian Government Initiative. New research examines comorbidities of dementia. Accessed November 20, 2014.
Government of Canada, Human Resources and Skills Development Canada, Labour Program. 2006. Employment Equity Data Report. Accessed August 6, 2014.
Johansen, H., C. Sanmartin, and the Longitudinal Health and Administrative Data Research Team. 2011. Mental comorbidity and its contribution to increased use of acute care hospital services. Health Research Working Paper Series, no. 006. Statistics Canada Catalogue no. 82-622-X. Ottawa: Statistics Canada.
National Institute on Aging. Understanding Memory Loss (Publication No.10-5442). Bethesda, MD: U.S. Department of Health and Human Services, 2010.
Statistics Canada. National Household Survey Dictionary, 2011. Accessed July 30, 2014.
Notes
- Date modified: