
Canadian Survey on Disability, 2012
Hearing disabilities among Canadians aged 15 years and older, 2012

Archived Content
Information identified as archived is provided for reference, research or recordkeeping purposes. It is not subject to the Government of Canada Web Standards and has not been altered or updated since it was archived. Please "contact us" to request a format other than those available.
by Christine Bizier, Ricardo Contreras and Alyssa Walpole
The results presented in this fact sheet are from the 2012 Canadian Survey on Disability (CSD), which surveyed residents of private dwellings who reported an activity limitation and who were aged 15 years and older at the time of the 2011 National Household Survey (NHS).
According to the CSD, respondents are considered to have a disability only if they report a difficulty or impairment due to a long-term condition or health problem and they report that they are limited in their daily activities as a result of their condition. Appendix A describes how the CSD defines hearing disabilities.
It should be noted that the population living in institutions, including residential care facilities, was not included in the 2012 CSD. Further details are available in the Canadian Survey on Disability, 2012: Concepts and Methods Guide: 89-654-X2014001.
According to the 2012 Canadian Survey on Disability (CSD), 3,775,900 (13.7%) Canadians aged 15 years and older reported some type of disability, and 874,600 (3.2% of Canadian adults) were identified as having a hearing disability that limited them in their daily activities (Table 1). Among adults aged 15 years and older who were identified as having a hearing disability, 75.2% reported that they had some difficulty hearing, while 22.5% had a lot of difficulty.
| Disability type | Population | Percentage |
|---|---|---|
| Total disability | 3,775,900 | 13.7 |
| Pain-related | 2,664,200 | 9.7 |
| Flexibility | 2,078,000 | 7.6 |
| Mobility | 1,971,800 | 7.2 |
| Mental health-related | 1,059,600 | 3.9 |
| Dexterity | 953,100 | 3.5 |
| Hearing | 874,600 | 3.2 |
| Seeing | 756,300 | 2.8 |
| Memory | 628,200 | 2.3 |
| Learning | 622,300 | 2.3 |
| Developmental | 160,500 | 0.6 |
| Unknown | 79,500 | 0.3 |
|
Note: Individuals may have more than one type of disability; therefore, the sum of all individual disability types is greater than the number of “total disabilities". Source: Statistics Canada, Canadian Survey on Disability, 2012. |
||
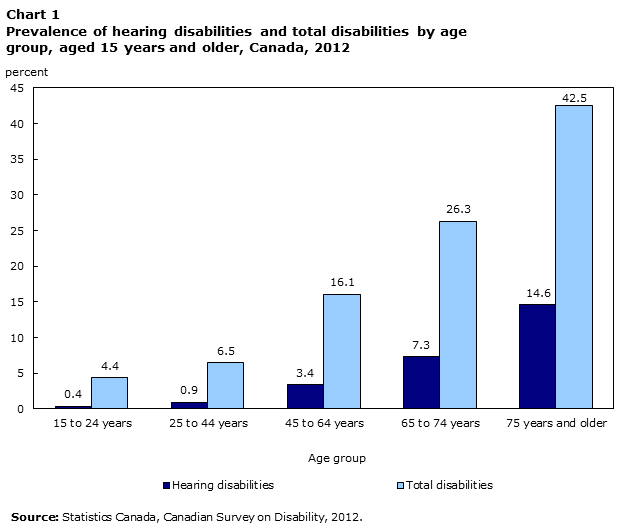
Chart 1 highlights that the prevalence of both hearing disabilities and all disabilities increased with age. For example, among adults aged 15 to 24, 0.4% reported having a hearing disability, while among those aged 75 and older, 14.6% reported having a hearing disability.
The difference in hearing disability rates between men and women was significant for those aged 65 to 74, at 8.9% and 5.9%, respectively, and for those aged 75 and older, at 17.0% and 12.9%, respectively, but not for other age groups.
Description for chart 1
The title of the graph is "Chart 1 Prevalence of hearing disabilities and total disabilities by age group, aged 15 years and older, Canada, 2012."
This is a column clustered chart.
There are in total 5 categories in the horizontal axis. The vertical axis starts at 0 and ends at 45 with ticks every 5 points.
There are 2 series in this graph.
The vertical axis is "percent."
The horizontal axis is "Age group."
The title of series 1 is "Hearing disabilities."
The minimum value is 0.4 and it corresponds to "15 to 24 years."
The maximum value is 14.6 and it corresponds to "75 years and older."
The title of series 2 is "Total disabilities."
The minimum value is 4.4 and it corresponds to "15 to 24 years."
The maximum value is 42.5 and it corresponds to "75 years and older."
| Hearing disabilities | Total disabilities | |
|---|---|---|
| 15 to 24 years | 0.4 | 4.4 |
| 25 to 44 years | 0.9 | 6.5 |
| 45 to 64 years | 3.4 | 16.1 |
| 65 to 74 years | 7.3 | 26.3 |
| 75 years and older | 14.6 | 42.5 |
Multiple disabilities
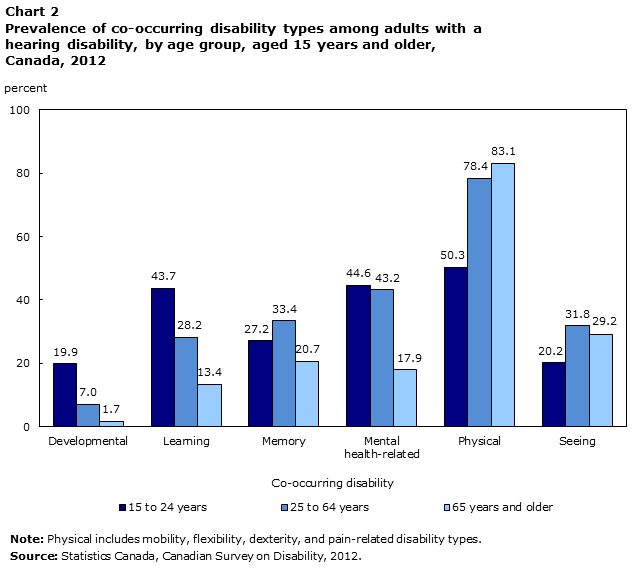
Hearing disabilities frequently co-occurred with other types of disability: 85.9% of people with a hearing disability reported at least one other type of disability.
The pattern of co-occurrence varied by age. Physical disability had the highest rate of co-occurrence for adults with a hearing disability among all age groups. Hearing disability also frequently co-occurred with mental health-related disability for younger (aged 15 to 24) and middle-aged adults (aged 25 to 64). Learning disability had a high rate of co-occurrence among adults with a hearing disability aged 15 to 24.
Description for chart 2
The title of the graph is "Chart 2 Prevalence of co-occurring disability types among adults with a hearing disability, by age group, aged 15 years and older, Canada, 2012."
This is a column clustered chart.
There are in total 6 categories in the horizontal axis. The vertical axis starts at 0 and ends at 100 with ticks every 20 points.
There are 3 series in this graph.
The vertical axis is "percent."
The horizontal axis is "Co-occurring disability."
The title of series 1 is "15 to 24 years."
The minimum value is 19.9 and it corresponds to "Developmental."
The maximum value is 50.3 and it corresponds to "Physical."
The title of series 2 is "25 to 64 years."
The minimum value is 7.0 and it corresponds to "Developmental."
The maximum value is 78.4 and it corresponds to "Physical."
The title of series 3 is "65 years and older."
The minimum value is 1.7 and it corresponds to "Developmental."
The maximum value is 83.1 and it corresponds to "Physical."
| 15 to 24 years | 25 to 64 years | 65 years and older | |
|---|---|---|---|
| Developmental | 19.9 | 7.0 | 1.7 |
| Learning | 43.7 | 28.2 | 13.4 |
| Memory | 27.2 | 33.4 | 20.7 |
| Mental health-related | 44.6 | 43.2 | 17.9 |
| Physical | 50.3 | 78.4 | 83.1 |
| Seeing | 20.2 | 31.8 | 29.2 |
Education
Educational attainment
Adults with a hearing disability had a lower level of educational attainment than those who did not have any type of disability. Among adults aged 15 to 64, who were not currently attending school at the time of the survey, those with a hearing disability were more likely than those without any type of disability to have not completed high school (23.0% versus 13.1%). They were also less likely to have a postsecondary qualificationNote 1 than adults without any disability (50.3% versus 61.1%).
Effect of disability on educational experiences
Among adults aged 15 and older with a hearing disability, 9.4% reported that they were currently or had recently been in school.Note 2 Of these, 84.2% stated that their educational experiences were directly impacted by their disability.Note 3 The most common impacts reported by those with a hearing disability included having to change their choice of courses or career (49.4%), taking fewer courses (44.3%), and having their education interrupted (41.2%E) (Table 2).
| Effect of disability | Percentage |
|---|---|
| Choice of courses/career changed due to disability | 49.4 |
| Took fewer courses due to disability | 44.3 |
| Education interrupted due to disability | 41.2Note E: Use with caution |
| Took longer to achieve current level due to disability | 38.3Note E: Use with caution |
| Changed course of studies due to disability | 36.4Note E: Use with caution |
| People avoid/exclude due to disability | 36.4Note E: Use with caution |
| Went back to school for retraining due to disability | 34.3Note E: Use with caution |
| Additional school expenses due to disability | 32.8Note E: Use with caution |
| Attended special education in a regular school due to disability | 31.6Note E: Use with caution |
|
E use with caution Note: Includes individuals currently in school or in school within the last five years and who had a disability while in school. Source: Statistics Canada, Canadian Survey on Disability, 2012. |
|
Educational aids and services
Among those with hearing disabilities, aged 15 and older currently attending or who recently attended school, 24.6% required some sort of education aid or service. Of those who required educational aids or services, 58.8% reported that all of their needs had been met, 38.6% reported that at least some of their needs had been met, while 2.6% reported that none of their needs had been met.
Employment
Labour force status
Among adults with a hearing disability, aged 15 to 64, 43.6% were not in the labour force, and another 8.5%E were unemployed.
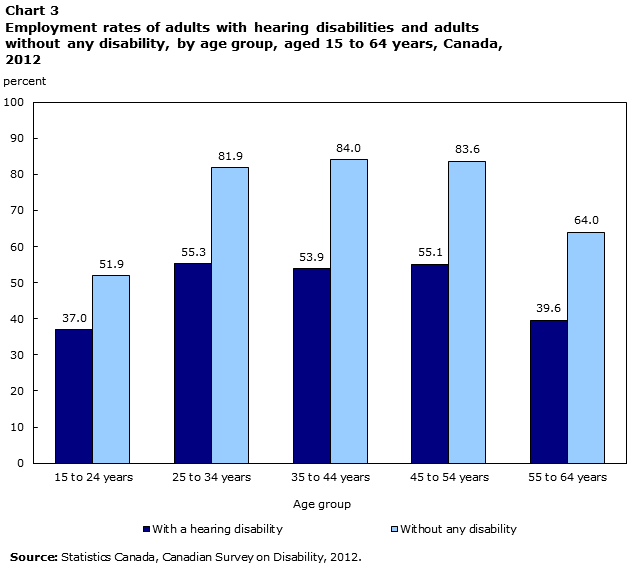
The employment rate of working-age adults, aged 15 to 64, with a hearing disability was 47.9%: this was much lower than the employment rate for adults without any disability (73.6%). The difference in employment rates was observable for all age groups (Chart 3).
Description for chart 3
The title of the graph is "Chart 3 Employment rates of adults with hearing disabilities and adults without any disability, by age group, aged 15 to 64 years, Canada, 2012."
This is a column clustered chart.
There are in total 5 categories in the horizontal axis. The vertical axis starts at 0 and ends at 100 with ticks every 10 points.
There are 2 series in this graph.
The vertical axis is "percent."
The horizontal axis is "Age group."
The title of series 1 is "With a hearing disability."
The minimum value is 37.0 and it corresponds to "15 to 24 years."
The maximum value is 55.3 and it corresponds to "25 to 34 years."
The title of series 2 is "Without any disability."
The minimum value is 51.9 and it corresponds to "15 to 24 years."
The maximum value is 84.0 and it corresponds to "35 to 44 years."
| With a hearing disability | Without any disability | |
|---|---|---|
| 15 to 24 years | 37.0 | 51.9 |
| 25 to 34 years | 55.3 | 81.9 |
| 35 to 44 years | 53.9 | 84.0 |
| 45 to 54 years | 55.1 | 83.6 |
| 55 to 64 years | 39.6 | 64.0 |
Overall, there was a significant difference in the employment rates for men and women with a hearing disability. While 53.7% of men were employed, only 41.5% of women were employed. When employment rates were compared within age groups, the only significant gender difference was for adults aged 45 to 54: in this age group, 69.4% of men were employed and only 42.2% of women were employed. The other age groups had slight but non-significant differences in employment rates.
Disability in the workplace
One-third (33.8%) of adults with a hearing disability who were employed reported that their employer was unaware of their condition(s).
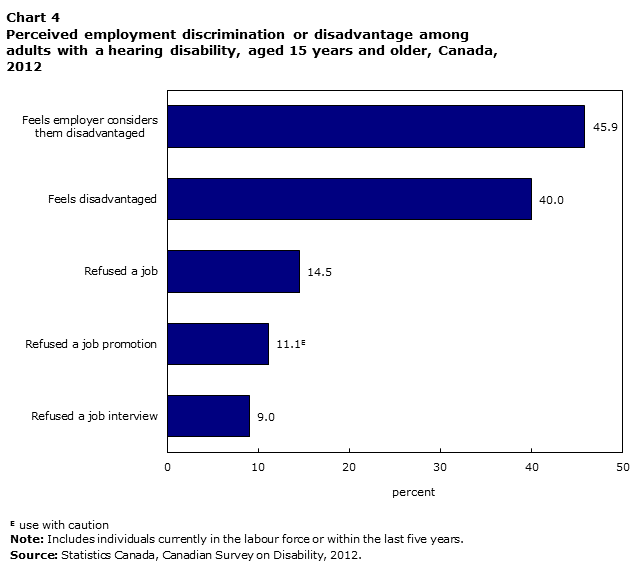
Among those with a hearing disability who were either in the labour market at the time of the survey or had been in the previous five years, 45.9% reported that they believed their employer considered them disadvantaged in the labour market and 40.0% reported that they themselves felt disadvantaged (Chart 4). In addition, 14.5% believed that they had been refused a job, 11.1%E believed they had been refused a promotion, and 9.0% believed they had been refused a job interview because of their disability or disabilities.Note 4
Description for chart 4
The title of the graph is "Chart 4 Perceived employment discrimination of disadvantage among adults with a hearing disability, aged 15 years and older, Canada, 2012."
This is a bar clustered chart.
This is a horizontal bar graph, so categories are on the vertical axis and values on the horizontal axis.
There are in total 5 categories in the vertical axis. The horizontal axis starts at 0 and ends at 50 with ticks every 10 points.
There are 1 series in this graph.
The horizontal axis is "percent."
The vertical axis is "Perceived employment discrimination or disadvantage."
The title of series 1 is "With a hearing disability percent."
The minimum value is 9.0 and it corresponds to "Refused a job interview."
The maximum value is 45.9 and it corresponds to "Feels employer considers them disadvantaged."
| percent | |
|---|---|
| Refused a job interview | 9.0 |
| Refused a job promotion | 11.1Note E: Use with caution |
| Refused a job | 14.5 |
| Feels disadvantaged | 40.0 |
| Feels employer considers them disadvantaged | 45.9 |
Job modifications
Among adults with a hearing disability, who were or had been recently employed,Note 5 38.5% said that they required at least one type of job accommodation. Of these, 59.2% reported that all of their needs had been met, 20.0% reported that some of their needs had been met, and 20.8% reported that none of their needs had been met. The most commonly required accommodation was modified work hours (21.4%). Of those who required modified work hours, 65.8% reported that their need was unmet.
Hours worked
Employed working-age adults, aged 15 to 64, with a hearing disability worked approximately the same number of hours per weekNote 6 as employed adults without any reported type of disability (37 hours). Of those who worked fewer than 30 hours per week on average, 24.2%E reported that the main reason they did so was due to their disability or health condition and 30.4% reported that they could not find more hours, or that more hours were not available.
Not in the labour force
The proportion of adults with a hearing disability who were not in the labour force was lowest for those between the ages of 25 and 44 (26.6%E). It was higher for the 15 to 24 age group (53.7%), and was also higher for those aged 45 to 54 (40.9%) and 55 to 64 (53.8%).
A large percentage of adults with a hearing disability between the ages of 15 and 64 reported that their condition prevented them from working (75.3%).Note 7 Of those whose condition prevented them from working, 15.3%E said that there was some type of accommodation that would allow them to work, and 20.8%E said that they were intending to look for work during the next year.
The most commonly cited barriers preventing adults with a hearing disability from entering the labour force included: being unsuccessful at finding a job in the past (31.6%E), not having adequate training or experience (31.3%E), and there being few locally available jobs (30.9%E).
Supports
Hearing aids
Among all adults aged 15 and older with a hearing disability that limited their daily activities, 32.0% reported that they lip-read, and 3.6%E reported using sign language.
Over half (55.1%) of adults with a hearing disability aged 15 and older reported they used at least one type of aid or assistive device. The types of aids or assistive devices most frequently used by adults with a hearing disability were hearing aids (30.7%), telephone-related devices such as volume controllers/flashers (25.0%), and closed captioning on their television (19.0%) (Chart 5).
Approximately two-thirds (67.5%) of adults aged 15 and older with a hearing disability reported that they needed at least one type of hearing aid or assistive device. Of these, 56.2% stated all of their needs had been met, 25.4% stated some of their needs had been met, and 18.4% stated that none of their needs had been met. Of those who did not have access to a required aid, 48.9% reported that at least one of the reasons was its high cost. Of adults with a hearing disability, who used at least one type of hearing aid or assistive device, 33.1% reported that they had incurred some out-of-pocket or direct expenses.Note 8
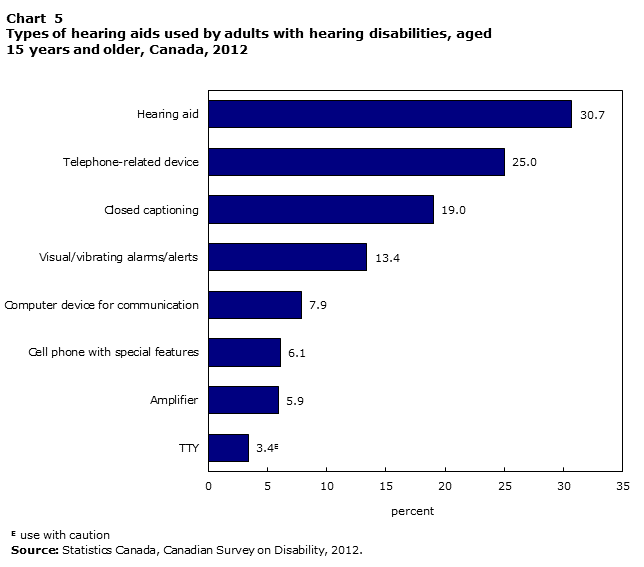
Description for chart 5
The title of the graph is "Chart 5 Types of hearing aids used by adults with hearing disabilities, aged 15 years and older, Canada, 2012."
This is a bar clustered chart.
This is a horizontal bar graph, so categories are on the vertical axis and values on the horizontal axis.
There are in total 8 categories in the vertical axis. The horizontal axis starts at 0 and ends at 35 with ticks every 5 points.
There are 1 series in this graph.
The horizontal axis is "percent."
The vertical axis is "Type of hearing aids."
The title of series 1 is "With a hearing disability percent."
The minimum value is 3.4E and it corresponds to "TTY."
The maximum value is 30.7 and it corresponds to "Hearing aid."
| percent | |
|---|---|
| TTY | 3.4Note E: Use with caution |
| Amplifier | 5.9 |
| Cell phone with special features | 6.1 |
| Computer device for communication | 7.9 |
| Visual/vibrating alarms/alerts | 13.4 |
| Closed captioning | 19.0 |
| Telephone-related device | 25.0 |
| Hearing aid | 30.7 |
Income
Personal income for working-age adults
Working-age adults with a hearing disability,Note 9 aged 15 to 64, reported a median personal income of $24,200 (before taxes), which was significantly lower than that of adults without any reported type of disability ($31,200).Note 10 Among those with employment income, the median employment income for adults with a hearing disability was lower than that of adults without any disability ($27,100 and $34,100 respectively).
Adults with a hearing disability were far more likely to receive government transfersNote 11 as a major source of income compared to adults without any disability. Among those who received government transfers, the median transfer income for adults with a hearing disability was $7,800, over four times that of adults without any disability ($1,600). Further, 46.0% of adults with a hearing disability aged 15 to 64 received more from government transfers than they did from employment income; this was true for only 18.7% of those without any disability.Note 12
Conclusion
Adults with a hearing disability face significant challenges in their daily lives. Co-occurrence of hearing disability with other disability types was very high, and was observable across all age groups. Adults with a hearing disability had lower educational outcomes than adults without any type of disability, and they reported that their disability had directly affected their educational experience. There were lower employment rates for adults with a hearing disability than for adults without any disability, and many reported additional difficulties related to their work experiences. This included facing discrimination, having unmet requirements for job accommodations, and facing barriers to finding a job. Adults with a hearing disability also experienced lower income and a higher proportion was in receipt of government transfers.
Start of text box
Appendix A
Identification of adults with a hearing disability
The 2012 Canadian Survey on Disability (CSD) identifies persons with a hearing disability as persons whose daily activities are limited because of difficulties with their ability to hear. The survey used the newly developed Disability Screening Questions (DSQ) to identify disability. The initial step in identifying a hearing disability was to establish the existence of a hearing condition. This was done using the following question:
DSQ_01
Do you have any difficulty seeing or hearing?
For those who said yes to such a condition, another question was asked to determine the amount of difficulty a person has in hearing (with their hearing aid or cochlear implant, where applicable):
DSQ_11
With your hearing aid or cochlear implant, which of the following best describes your ability to hear: You
- Have no difficulty hearing
- Have some difficulty (hearing)
- Have a lot of difficulty (hearing)
- Cannot hear at all
- Are deaf
Those who reported having at least some difficulty hearing received a follow-up question to determine how often this difficulty limited their daily activities:
DSQ_12
How often does this difficulty/condition limit your daily activities?
- Never
- Rarely
- Sometimes
- Often
- Always
A hearing disability was identified when respondents reported being limited at least sometimes, regardless of degree of difficulty. If they reported being limited rarely, they were only considered to have a hearing disability if they also indicated having a lot of difficulty or if they reported being unable to hear at all or were deaf.
An estimated 1,821,200 Canadian adults reported having a hearing condition. Of these, 946,600 (3.4% of the adult population) reported not being limited by their condition. However, 874,600 (3.2%) Canadian adults aged 15 years and older, and 424,840 (1.5%) Canadian working-age adults (aged 15 to 64) were identified as having a hearing disability, based on the methodology described above.
End of text box
- Date modified: