
Canadian Survey on Disability, 2012
Flexibility disabilities among Canadians aged 15 years and older, 2012

Archived Content
Information identified as archived is provided for reference, research or recordkeeping purposes. It is not subject to the Government of Canada Web Standards and has not been altered or updated since it was archived. Please "contact us" to request a format other than those available.
by Christine Bizier, Gail Fawcett and Sabrina Gilbert
The results presented in this fact sheet are from the 2012 Canadian Survey on Disability (CSD), which surveyed residents of private dwellings who reported an activity limitation and who were aged 15 years and older at the time of the 2011 National Household Survey (NHS).
According to the CSD, respondents are considered to have a disability only if they report a difficulty or impairment due to a long-term condition or health problem and they report that they are limited in their daily activities as a result of their condition. Appendix A describes how the CSD defines flexibility disabilities.
It should be noted that the population living in institutions, including residential care facilities, was not included in the 2012 CSD. Further details are available in the Canadian Survey on Disability, 2012: Concepts and Methods Guide: 89-654-X2014001.
According to the 2012 Canadian Survey on Disability (CSD), 3,775,900 (13.7%) Canadians aged 15 years and older reported some type of disability, and 2,078,000 of these individuals (or 7.6% of all Canadian adults) were identified as having a flexibility disability that limited them in their daily activities (Table 1). The most prevalent underlying condition reported by those with flexibility disabilities was arthritis.
| Disability type | Population | Percentage |
|---|---|---|
| Total disability | 3,775,900 | 13.7 |
| Pain-related | 2,664,200 | 9.7 |
| Flexibility | 2,078,000 | 7.6 |
| Mobility | 1,971,800 | 7.2 |
| Mental health-related | 1,059,600 | 3.9 |
| Dexterity | 953,100 | 3.5 |
| Hearing | 874,600 | 3.2 |
| Seeing | 756,300 | 2.8 |
| Memory | 628,200 | 2.3 |
| Learning | 622,300 | 2.3 |
| Developmental | 160,500 | 0.6 |
| Unknown | 79,500 | 0.3 |
|
Note: Individuals may have more than one type of disability; therefore, the sum of all individual disability types is greater than the number of "total disabilities". Source: Statistics Canada, Canadian Survey on Disability, 2012. |
||
As with disability in general, the likelihood of having flexibility disabilities increased substantially with age—ranging from a prevalence rate of 1.0% for adults aged 15 to 24 to a rate of 19.3% for those aged 65 and older (Chart 1).
Overall, the prevalence of flexibility disabilities was slightly higher for women than men.
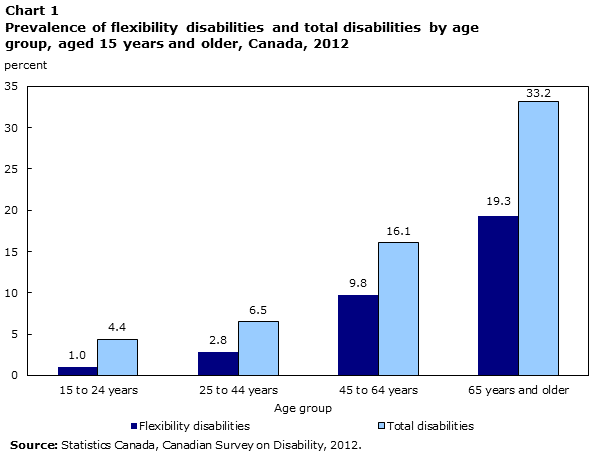
Data table for Chart 1
| Age group | Flexibility disabilities | Total disabilities |
|---|---|---|
| percent | ||
| 15 to 24 years | 1.0 | 4.4 |
| 25 to 44 years | 2.8 | 6.5 |
| 45 to 64 years | 9.8 | 16.1 |
| 65 years and older | 19.3 | 33.2 |
| Source: Statistics Canada, Canadian Survey on Disability, 2012. | ||
Multiple disabilities
Flexibility disability frequently co-occurred with other types of disability: 96.0% of those with flexibility disabilities also reported at least one other type of disability in 2012. Mobility disabilities and pain-related disabilities co-occurred with flexibility disabilities more often than any other type of disability regardless of age.
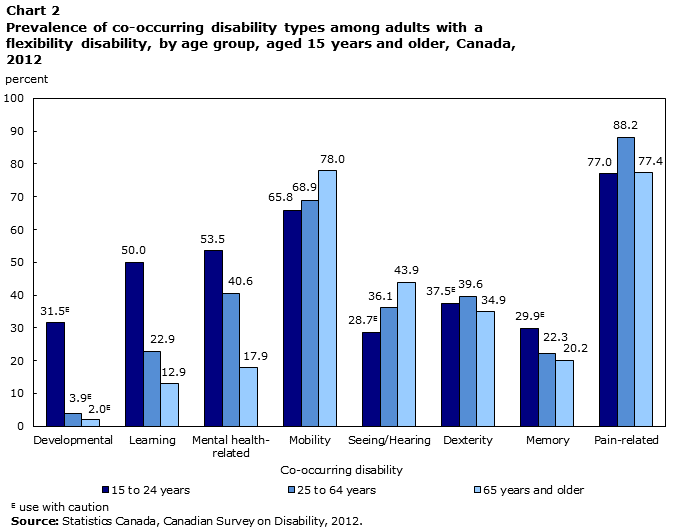
Data table for Chart 2
| Developmental | Learning | Mental health-related | Mobility | Seeing/Hearing | Dexterity | Memory | Pain-related | |
|---|---|---|---|---|---|---|---|---|
| percent | ||||||||
| 15 to 24 years | 31.5Note E: Use with caution | 50.0 | 53.5 | 65.8 | 28.7Note E: Use with caution | 37.5Note E: Use with caution | 29.9Note E: Use with caution | 77.0 |
| 25 to 64 years | 3.9Note E: Use with caution | 22.9 | 40.6 | 68.9 | 36.1 | 39.6 | 22.3 | 88.2 |
| 65 years and older | 2.0Note E: Use with caution | 12.9 | 17.9 | 78.0 | 43.9 | 34.9 | 20.2 | 77.4 |
|
E use with caution Source: Statistics Canada, Canadian Survey on Disability, 2012. |
||||||||
Education
Educational attainment
Adults with flexibility disabilities had overall lower levels of educational attainment than those who did not have any type of disability. For example, adults aged 15 to 64 who were not in school and who reported a flexibility disability were more likely than those without any type of disability to have not completed high school (21.8% versus 13.1%). This pattern was particularly pronounced among those aged 15 to 44 with flexibility disabilities, who were more than twice as likely to have not completed high school, compared with those without any type of disability. For example, slightly over one-half (55.3%) of young adults aged 15 to 24 with flexibility disabilities had not completed high school at the time of the survey, compared to just about one-fourth (25.4%) of their counterparts who did not have any disability. In the 25 to 44 age group, the rates were 20.4% for those with flexibility disabilities and 9.5% for those without any disabilities.Note 1
Similarly, those aged 15 to 64 with a flexibility disability were less likely (48.5%) than their counterparts without a disability (61.1%) to have completed postsecondary qualifications.Note 2
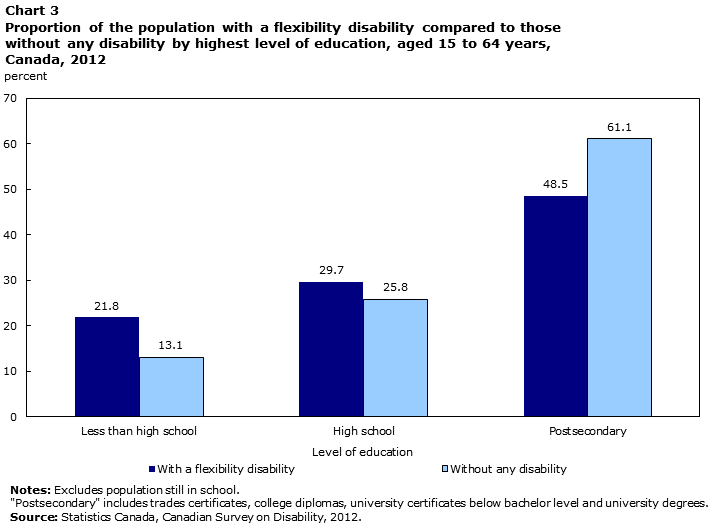
Data table for Chart 3
| Level of education | With a flexibility disability | Without any disability |
|---|---|---|
| percent | ||
| Less than high school | 21.8 | 13.1 |
| High school | 29.7 | 25.8 |
| Postsecondary | 48.5 | 61.1 |
|
Notes: Excludes population still in school. "Postsecondary" includes trades certificates, college diplomas, university certificates below bachelor level and university degrees. Source: Statistics Canada, Canadian Survey on Disability, 2012. |
||
Educational experiences
In the 2012 Canadian Survey on Disability (CSD), adults with a disability who were currently or had recently been in school were asked a series of questions about their educational experiences and how their condition or conditions may have affected these experiences. More than half of the adults with a flexibility disability reported that their condition(s) had influenced their choice of courses/careers (Table 2).
| Effect of disability | Percentage |
|---|---|
| Choice of courses/career influenced by disability | 57.8 |
| Went back to school for retraining due to disability | 44.0 |
| Took fewer courses due to disability | 42.1 |
| Took longer to achieve current level due to disability | 39.0 |
| Education interrupted due to disability | 37.9 |
| Changed course of studies due to disability | 35.1 |
|
Note: Includes individuals currently in school or in school within the last five years and who had a disability while in school. Source: Statistics Canada, Canadian Survey on Disability, 2012. |
|
Employment
Labour force status
More than half (54.9%) of adults aged 15 to 64 with a flexibility disability were not in the labour force, and another 6.1% were unemployed.Note 3
The employment rate of working-age adults, aged 15 to 64, with flexibility disabilities was 39.1%, which is slightly over half the employment rate of those aged 15 to 64 who did not have any type of disability (73.6%). Men with flexibility disabilities were more likely to be employed than their female counterparts (43.6% versus 35.4%).
In each age group, those without any disability were roughly twice as likely to be employed as those with a flexibility disability. This pattern was more pronounced in the youngest and oldest age groups (Chart 4).
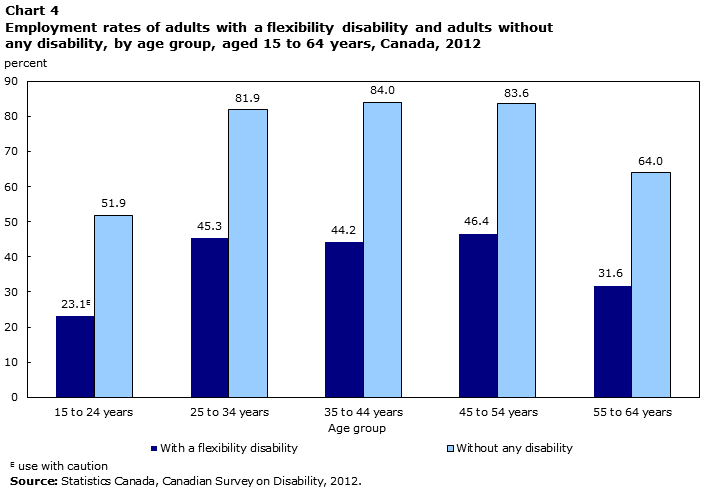
Data table for Chart 4
| 15 to 24 years | 25 to 34 years | 35 to 44 years | 45 to 54 years | 55 to 64 years | |
|---|---|---|---|---|---|
| percent | |||||
| With a flexibility disability | 23.1Note E: Use with caution | 45.3 | 44.2 | 46.4 | 31.6 |
| Without any disability | 51.9 | 81.9 | 84.0 | 83.6 | 64.0 |
|
E use with caution Source: Statistics Canada, Canadian Survey on Disability, 2012. |
|||||
Disability in the workplace
Nearly a quarter (22.9%) of employed adults with a flexibility disability indicated that their employer was unaware of their condition(s).
Among those with a flexibility disability who were either in the labour market at the time of the survey or had been in the labour market within five years prior to the survey, 51.7% reported that they believed their employer considered them disadvantaged and 49.3% reported that they felt disadvantaged in the labour market (Chart 5). With respect to more specific indicators of disadvantage in the labour market, 13.5% believed that they had been refused a job, 9.0% felt they had been refused a promotion, and 8.6% believed they had been refused a job interview—all due to their disability or disabilities. It is important to remember that this is based on the impact of all disability types these individuals with flexibility disabilities may have had.
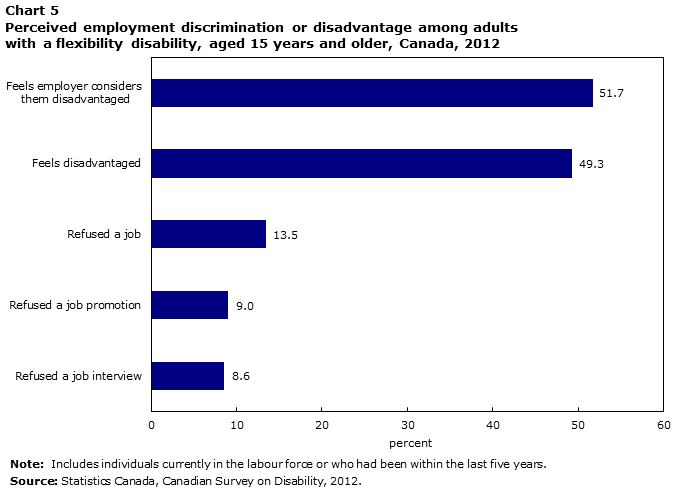
Data table for Chart 5
| Perceived discrimination or disadvantage | Percent |
|---|---|
| Feels employer considers them disadvantaged | 51.7 |
| Feels disadvantaged | 49.3 |
| Refused a job | 13.5 |
| Refused a job promotion | 9.0 |
| Refused a job interview | 8.6 |
|
Note: Includes individuals currently in the labour force or who had been within the last five years. Source: Statistics Canada, Canadian Survey on Disability, 2012. |
|
Job modifications
Overall, 53.9% of adults with a flexibility disability who were or had been recently employedNote 4 stated that they needed at least one type of job accommodation such as modified work hours (30.4%), special back supports (25.4%), modified duties (20.6%), a modified workstation (17.6%) and other job accommodations. Of those requiring modifications, 49.0% reported that all of their needs had been met, while 26.6% indicated that some needs had been met. Another 24.4% reported that none of their needs had been met. Given the high rate of co-occurrence with other types of disabilities, some of these accommodations may have been for disabilities other than flexibility.
Hours worked
Employed, working-age adults aged 15 to 64 with a flexibility disability worked an average of 34 hours per week,Note 5 which is lower than the average number for those without any reported type of disability (37 hours).Note 6
Not in the labour force
Among adults with a flexibility disability aged 15 to 64 who were not in the labour force, the majority (83.3%) reported that their condition(s) prevented them from working. Of these individuals, 18.2% indicated that some type of accommodation would allow them to work. As well, 22.9% indicated that they would look for work in the next 12 months.Note 7 Respondents who planned to look for work were asked why they intended to do so:
- 36.4% expected their condition to improve,
- 11.7%E expected workplace changes/improvements, and
- 10.1%E planned to take training.
Many of those who were not in the labour force encountered barriers that discouraged them from looking for work. Some of the most commonly reported job search barriers for those with a flexibility disability were the lack of available local jobs (20.9%), inadequate training or experience (18.1%), and unsuccessful past attempts (18.0%) (Chart 6).
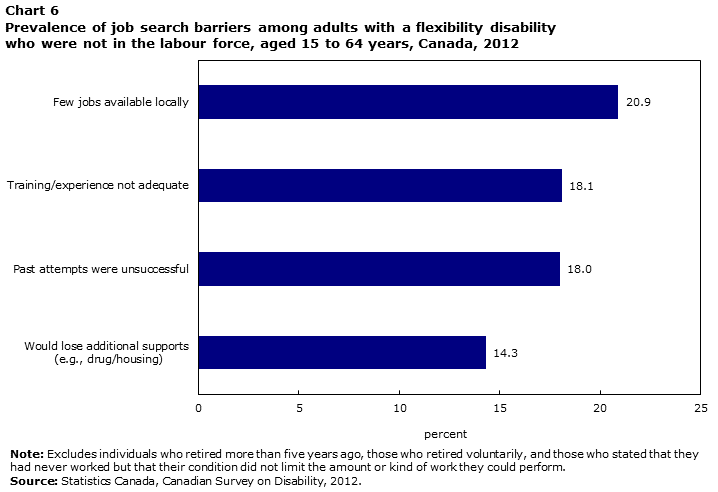
Data table for Chart 6
| Job search barriers | Percent |
|---|---|
| Few jobs available locally | 20.9 |
| Training/experience not adequate | 18.1 |
| Past attempts were unsuccessful | 18.0 |
| Would lose additional supports (e.g., drug/housing) | 14.3 |
|
Note: Excludes individuals who retired more than five years ago, those who retired voluntarily, and those who stated that they had never worked but that their condition did not limit the amount or kind of work they could perform. Source: Statistics Canada, Canadian Survey on Disability, 2012. |
|
Supports
Overall, about 85.1% of adults with a flexibility disability indicated that they required help with some type of everyday activity, and nearly two-thirds (64.7%) of them reported having some level of unmet need for at least one of these support requirements.
While over three-quarters (78.5%) of all adults with a flexibility disability reported receiving help with at least one type of everyday activity, there was an unmet need for various specific types of supports, as summarized in Chart 7. For example, 38.4% of all adults with a flexibility disability had an unmet need for help with heavy household chores, while 6.3% had an unmet need for help with moving around.
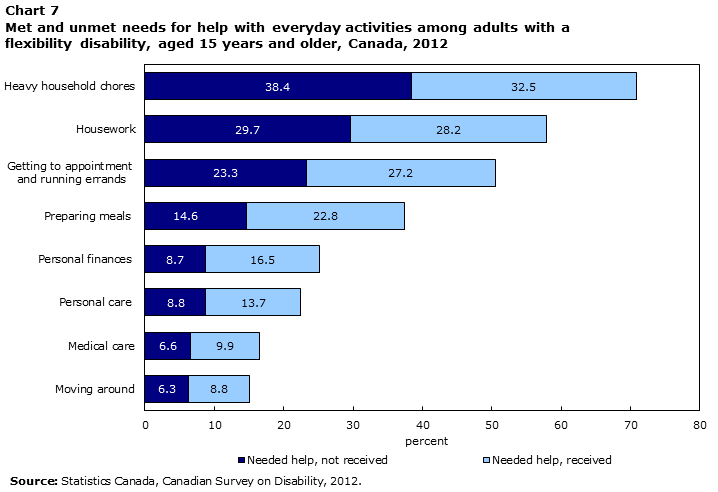
Data table for Chart 7
| Help with everyday activities | Needed help, not received | Needed help, received |
|---|---|---|
| percent | ||
| Heavy household chores | 38.4 | 32.5 |
| Housework | 29.7 | 28.2 |
| Getting to appointment and running errands | 23.3 | 27.2 |
| Preparing meals | 14.6 | 22.8 |
| Personal finances | 8.7 | 16.5 |
| Personal care | 8.8 | 13.7 |
| Medical care | 6.6 | 9.9 |
| Moving around | 6.3 | 8.8 |
| Source: Statistics Canada, Canadian Survey on Disability, 2012. | ||
Help with everyday activities was most likely to have come from family members, particularly those in the same household. For example, among those receiving assistance with such activities, two-thirds (66.0%) of those with flexibility disabilities received some help from family members living with them and 43.0% received some help from family members who were not living with them. Help with everyday activities came from other sources as well. For example, among those who received some assistance, 28.5% of adults with flexibility disabilities also indicated receiving help from a friend or neighbour, 21.5% paid an individual or organization for help, and 13.9% reported receiving help from an organization free of charge.
Income
Personal income for working-age adults
The median personal income (before taxes) of working-age adults aged 15 to 64 with a flexibility disabilityNote 8 was $17,900—slightly more than half that of those without any reported type of disability ($31,200).Note 9 Working-age men with flexibility disabilities had a higher median personal income than their female counterparts ($21,700 versus $16,600).
Those with a flexibility disability were also more likely to be reliant on government transfersNote 10 (56.5%) as their major source of income compared to those without any reported type of disability (18.7%). Furthermore, it was found that employed adults aged 15 to 64 with a flexibility disability had a lower median employment incomeNote 11 than those without any reported type of disability ($24,200 versus $34,100). Men with flexibility disabilities had a higher median employment income than women with flexibility disabilities ($31,000 versus $20,000).
Conclusion
Adults with a flexibility disability face many challenges. Co-occurrence with other disability types was very high. In particular, the majority of individuals with a flexibility disability also had a mobility disability and/or a pain-related disability, and this was observed across all age groups. At the same time, educational attainment and employment levels among those with a flexibility disability were lower than for those who did not report any disability. Even when employed, those with a flexibility disability had lower levels of employment income. Consequently, it is not surprising that working-age adults with a flexibility disability were also more likely than those without any disability to rely on government transfers as their major source of income. Nearly 9 in 10 adults with a flexibility disability required some type of help with everyday activities (in particular, the more physically demanding activities such as heavy household chores and housework), and about two-thirds of them had some level of unmet need.
Start of text box
Appendix A
Identification of adults with a flexibility disability
The 2012 Canadian Survey on Disability (CSD) identifies persons with a flexibility disability as persons whose daily activities are limited because of difficulties with their ability to bend down and pick up an object from the floor and/or with reaching in any direction. The survey used the newly developed Disability Screening Questions (DSQ) to identify disability. The initial step in identifying a flexibility disability was to establish the existence of difficulty with flexibility. This was done using the following questions:
DSQ_16
How much difficulty do you have bending down and picking up an object from the floor?
- No difficulty
- Some (difficulty)
- A lot (of difficulty)
- You cannot do at all
DSQ_17
How much difficulty do you have reaching in any direction, for example, above your head?
- No difficulty
- Some (difficulty)
- A lot (of difficulty)
- You cannot do at all
Those who reported having at least “some” difficulty with either task received a follow-up question to determine how often this difficulty limited their daily activities:
DSQ_18
How often does this difficulty bending and picking up an object or reaching limit your daily activities?
- Never
- Rarely
- Sometimes
- Often
- Always
A flexibility disability was identified when respondents reported being limited at least sometimes, regardless of degree of difficulty. If they reported being limited rarely, they were considered to have a flexibility disability if they also indicated having a lot of difficulty or reported being unable to perform at least one of the two tasks.
An estimated 2,854,100 Canadian adults reported having difficulty with at least one of the two flexibility tasks. Of these, 776,100 (2.8% of the adult population) reported not being limited by their condition. However, 2,078,000 (7.6%) Canadian adults were identified as having a flexibility disability, based on the methodology described above.
End of text box
- Date modified: