

Archived Content
Information identified as archived is provided for reference, research or recordkeeping purposes. It is not subject to the Government of Canada Web Standards and has not been altered or updated since it was archived. Please "contact us" to request a format other than those available.
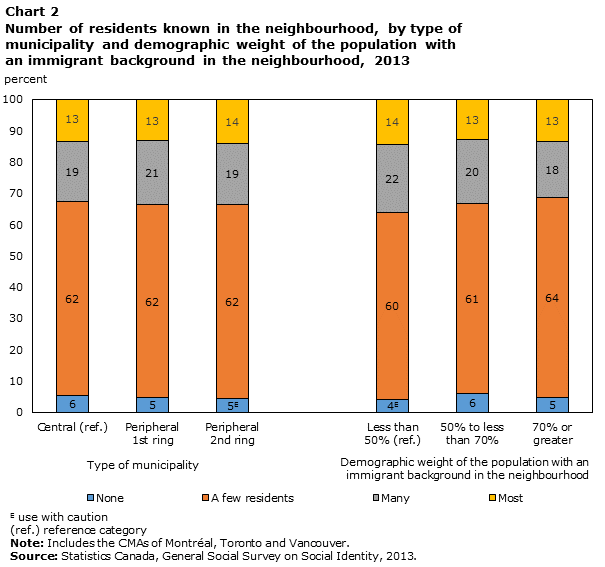
Data table for Chart 2
| Type of municipality | None | A few residents | Many | Most |
|---|---|---|---|---|
| percent | ||||
| Central (ref.) | 6 | 62 | 19 | 13 |
| Peripheral 1st ring | 5 | 62 | 21 | 13 |
| Peripheral 2nd ring | 5Note E: Use with caution | 62 | 19 | 14 |
| Demographic weight of the population with an immigrant background in the neighbourhood | ||||
| Less than 50% (ref.) | 4Note E: Use with caution | 60 | 22 | 14 |
| 50% to less than 70% | 6 | 61 | 20 | 13 |
| 70% or greater | 5 | 64 | 18 | 13 |
|
E use with caution (ref.) reference category Note: Includes CMAs of Montréal, Toronto and Vancouver. Source: Statistics Canada, General Social Survey on Social Identity, 2013. |
||||
- Date modified: