
The changing face of the Canadian fruit and vegetable sector: 1941 to 2011

Archived Content
Information identified as archived is provided for reference, research or recordkeeping purposes. It is not subject to the Government of Canada Web Standards and has not been altered or updated since it was archived. Please "contact us" to request a format other than those available.
By Erik Dorff, Statistics Canada
- Horticulture produces a wide range of foods and other products
- Blueberries and cranberries gain prominence
- Blueberry varieties
- Grape area declines for the first time in four censuses
- Tree fruits face challenges
- Vegetables show gains
- Floriculture
- Evolution of a sector
The 2011 Census of agriculture revealed a number of shifts in the Horticulture sector. Growth in the domestic greenhouse industry and an increase in imports have offered a greater range of food choices in recent decades. Changes in farming practices, such as increasing reliance on mechanization, have also played a role in shaping the mix of commodities grown on Canadian farms in 2011.
This article compares 2011 Census data on horticulture to the figures reported on the 1941 Census. The 1941 Census is noteworthy as it counted the most farms ever reported since agriculture data began to be collected in Canada. This comparison also provides a description of the changes that have occurred in horticulture over the span of seventy years.
Start of text box
Horticulture produces a wide range of foods and other products
Horticulture is a type of agriculture that encompasses a wide range of crop production. Fruit, vegetable, ornamental and medicinal plant culture all fall under the umbrella of horticulture. There are two broad categories of crops within horticulture: edible and non-edible crops.
Edible horticulture crops, such as fruits, vegetables and nuts, are products grown for human food that are either consumed fresh or processed into value-added products, such as frozen foods, preserves and wine. Although they are not biologically classified as plants, mushrooms are considered to be an edible product of horticulture. Medicinal plants which are grown for teas and supplements such as ginseng are also considered to be edible horticultural products.
Non-edible horticulture crops are not used as food but are rather produced for other purposes. For instance, cut flowers, bedding plants, shrubs, trees, and perennials are grown as ornamental plants to enhance the appearance of homes, offices, gardens and public spaces. Sod farming is another type of non-edible horticulture which produces established turf for lawns, parks and sports fields.
End of text box
Blueberries and cranberries gain prominence
The commercial harvesting of wild berries is not new, as evidenced in the 1941 Census of Agriculture that reported over 1.47 million kilograms of wild blueberries and 157,000 kilograms of wild cranberries harvested on farms (Table 1). At that time, crops of wild berries were harvested by hand or by raking.
| Province | Blueberries, Wild (unmanaged) | Blueberries, Highbush and Lowbush (managed) | Cranberries, Wild (unmanaged) | Cranberries, Cultivated (managed) | |
|---|---|---|---|---|---|
| 1940 | 2011 | 1940 | 1940 | 2011 | |
| kilograms | |||||
| Newfoundland and Labrador | .. | 97,000 | .. | .. | Note x: suppressed to meet the confidentiality requirements of the Statistics Act |
| Prince Edward Island | 96,421 | 6,050,000 | 27,898 | 1,642 | 357,000 |
| Nova Scotia | 112,412 | 13,347,000 | 19,805 | 86,878 | 1,472,000 |
| New Brunswick | 264,511 | 12,511,000 | 26,967 | 3,036 | 6,024,000 |
| Quebec | 642,103 | 28,149,000 | 13,953 | 1,197 | 50,573,000 |
| Ontario | 172,290 | 868,000 | 13,219 | 1,129 | Note x: suppressed to meet the confidentiality requirements of the Statistics Act |
| Manitoba | 18,619 | .. | 8,899 | 0 | Note ..: not available for a specific reference period |
| Saskatchewan | 74,644 | .. | 17,030 | 27 | Note ..: not available for a specific reference period |
| Alberta | 83,236 | .. | 27,364 | 159 | Note ..: not available for a specific reference period |
| British Columbia | 8,979 | 44,120,000 | 2,233 | 2,778 | 27,414,000 |
| Canada | 1,473,215 | 105,142,000 | 157,368 | 96,846 | 86,286,000 |
|
.. not available for a specific reference period x suppressed to meet the confidentiality requirements of the Statistics Act
|
|||||
What is relatively new, however, is the intensifying management of wild crops made possible by two recent developments—land was cleared to encourage the spread of wild berry crops, and, beginning in the mid-1980s, machinery was used for harvesting wild crops. Together, these factors have led to enhanced efficiency and productivity in the sector.
Start of text box
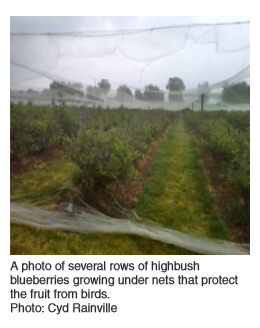
Blueberry varieties
There are two broad families of blueberries named for their height – highbush and lowbush. Highbush blueberry plants stand between 2 and 3 metres, while their lowbush counterparts are generally less than 0.4 metres (40 cm) tall. Highbush blueberries are planted and managed in much the same way as other berries and orchards and produce a larger berry. Since production is focused on pre-existing stands, lowbush blueberries are also commonly referred to as wild blueberries. Lowbush blueberry production is focused on managing existing stands of wild plants by encouraging their spread on land holdings and promoting the maximum production of smaller berries. Today, lowbush blueberries are more prevalent in Eastern Canada, whereas highbush berries dominate the sector in British Columbia.
End of text box
The Census of Agriculture began collecting specific information on managed lowbush and highbush blueberry area in 1986, at which time 16,247 hectares of the two types combined were reported across the country. The emergence of mechanical harvesting facilitated the rapid growth of the wild blueberry industry since growers were no longer dependent on manual labour for harvesting.
The blueberry sector has since undergone significant expansion as agronomic management techniques became further sophisticated—for instance, the adoption of fertilization, burning or mowing, and weed control—and commercial potential was realized. In fact, farmers reported 70,852 hectares of managed highbush and lowbush blueberries in the 2011 Census, making blueberries the single largest contributor to the area of total fruit and berries as it accounted for over half (56.1%) of that land base. Chart 1 shows the growth of highbush and lowbush blueberry area since 1986 for the four Atlantic Provinces, Quebec and British Columbia. Together, these provinces accounted for 99.5% of the blueberry area in the country as reported in the 2011 Census.
The cranberry sector experienced similar growth rates with production increasing from less than 800 hectares in 1986 to 6,100 hectares in 2011. In fact, 99.4% of the total cranberry area was reported in the four Atlantic Provinces, Quebec and British Columbia, the same regions that held the majority of blueberry area. As with blueberries, this growth was driven by mechanized harvesting (Chart 2).
Grape area declines for the first time in four censuses
The 2011 Census of Agriculture marked the first decline in grape area nationally in four Censuses as it dropped by 0.2% to 12,144 hectares since 2006. This drop occurred in Ontario, while grape area increased in all other provinces (Chart 3). Of interest is the fact that much of the expansion between 1991 and 2006 occurred outside of the Okanagan Valley of British Columbia and the Niagara region of Ontario, regions where grape production was predominantly concentrated in the past (Map 1). Underlying this expansion was the increase in demand for grape varieties suited to producing higher quality wines.
Map 1 Grape area in 2011, Canada
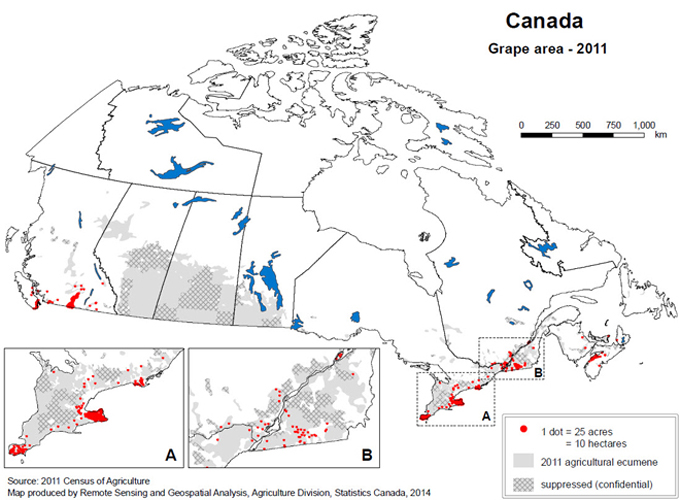
Note: cross-hatched areas indicate regions where there is a grape production, but the data is suppressed to meet the confidentiality requirements of the Statistics Act.
The last time a drop in grape area was observed was in the 1991 Census. At that time, production was centred on labrusca grapes because they were often used to produce wines. 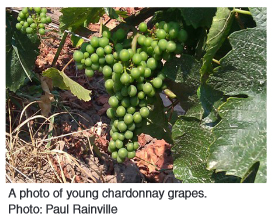 However, the implementation of the Canada-United States Free Trade Agreement in 1989 opened the Canadian market to competition from American wines made from vinifera and hybrid grapes. This prompted the realignment of the Canadian sector to compete with imported American wines, and much of the market for labrusca grapes was lost as vintners transitioned to vinifera and hybrid grapes. The result was the substantial drop in grape area noted by the 1991 Census of Agriculture (Chart 3).
Tree fruits face challenges
With the exception of cherries, the area dedicated to major tree fruits has shrunk since 1941 (Table 2).
| Fruit | 1941 | 2011 |
|---|---|---|
| hectares | ||
| Apples | 53,820 | 18,243 |
| Peaches | 8,260 | 3,154 |
| Pears | 3,822 | 944 |
| Plums and Prunes | 3,410 | 684 |
| Cherries (sweet and sour) | 2,570 | 3,099 |
| Sources: Statistics Canada, Census of Agriculture, 1941 and 2011 | ||
Cherries are the only tree fruit that gained in area between 1941 and 2011. Once again, this increase was mostly attributable to the advantages of mechanical harvesting. In particular, cherries that are primarily intended for processing are harvested using tree shakers, thereby reducing the labour requirements of this crop.
Although the area dedicated to most tree fruits declined during the last 70 years, there were notable increases in production efficiency in terms of the weight of fruit produced per hectare. The greatest gains occurred for apples, which were produced 4.3 times more intensively in 2011 compared to 1941.Note1 Over the same period, productivity (in terms of yield per hectare) was 2.4 times higher for pears, 2.0 times higher for cherries, 1.9 times greater for peaches, and 1.2 times higher for plums and prunes.
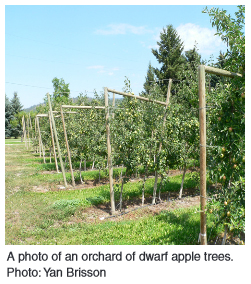
While tree fruits continue to be principally harvested manually imposing financial and logistical hurdles, many orchard operators have adopted reduced-stature trees (dwarf and columnar) to make harvesting faster and easier and also to simplify the pruning process. Compared to standard trees, reduced-stature fruit trees yield fruit at a younger age. Such agronomic changes have led to notable increases in production efficiency.
The increased productivity of major tree fruits did not compensate for declining land area, however, as total production dropped for major tree fruits. The exception was apples as productivity gains boosted 2011 production by 44.1% since 1941.
Nationally, the average per capita marketed production fell by half for apples in the past 70 years, and by a quarter for pears and peaches in that same period. Plums and prunes showed the greatest drop in per capita production in that time span since in 2011 it was less than a tenth of that reported in the 1941 Census (Table 3).
| Fruit | 1940/1941 | 2011 |
|---|---|---|
| kilograms per person | ||
| Apples | 23.6 | 11.8 |
| Peaches | 2.8 | 0.7 |
| Pears | 1.2 | 0.2 |
| Plums and Prunes | 0.9 | 0.1 |
| Cherries (sweet and sour) | 0.5 | 0.4 |
|
||
The decline in per capita production was partly due to the seasonality of fresh fruit production in Canada, expanding consumer choices not limited by what can be produced in the country, and the decline of market gardens. While fruit used to be more often canned, both in the home and in commercial processing, consumer choices are evolving towards fresh products that are available year-round. Historically, smaller operations had greater access to local markets, whereas today, large packing, marketing, and distribution operations, both in Canada and overseas, have a relative advantage in supplying fruit products to major store chains, which often demand large quantities of products on set schedules. This tends to favour larger operations that can produce at the lowest cost.
Vegetables show gains
The land area dedicated to most field vegetables increased significantly between 1941 and 2011 (Table 4).
| Vegetable | 1941 | 2011 |
|---|---|---|
| hectares | ||
| Beets | 859 | 1,556 |
| Cabbage | 2,423 | 4,156 |
| Carrots | 2,477 | 9,480 |
| Cauliflowers | 847 | 1,829 |
| Celery | 546 | 840 |
| Cucumbers | 1,183 | 2,339 |
| Green Beans | 1,850 | 8,497 |
| Green Peas | 7,524 | 11,965 |
| Lettuce | 934 | 3,382 |
| Onions | 2,438 | 5,927 |
| Sweet Corn | 8,543 | 23,173 |
| Tomatoes | 13,643 | 7,424 |
| Sources: Statistics Canada, Census of Agriculture, 1941 and 2011 | ||
The notable exception was field tomatoes, whose decline may be due to shifting preferences highlighted by the 18.7% increase in greenhouse vegetable area between 2006 and 2011. Part of this decline may be explained by the fact that the area dedicated to the production of greenhouse tomatoes grew almost tenfold, from just under 571,000 square meters in 1940 to 5.3 million square metres in 2011. In addition, greenhouse tomato production increased 80 fold in this same time period, from 3.4 million kilograms to 266.5 million kilograms. Growth in greenhouse vegetable area continued to be supported by consumer demand for year-round, high-quality produce, as well as export markets in the United States.
Moreover, while most areas of field vegetables increased, they also made significant gains in productivity. Specifically, beets, carrots, cucumbers, and tomatoes more than doubled in production per unit area between the 1941 and 2011 censuses (Table 5).
| Vegetable | 1940/1941 | 2011 |
|---|---|---|
| kilograms per hectare | ||
| Beets | 9,526 | 19,967 |
| Carrots | 13,706 | 43,477 |
| Cucumbers | 6,752 | 18,370 |
| Green Beans | 4,309 | 5,119 |
| Green Peas | 4,567 | 3,596 |
| Tomatoes | 13,958 | 63,524 |
| Sources: Statistics Canada, Census of Agriculture, 1941 and 2011, and CANSIM table 001-0013 | ||
With the exception of green peas and tomatoes, per capita marketed production also increased for most field vegetables between 1941 and 2011 (Table 6).
| Vegetable | 1940/1941 | 2011 |
|---|---|---|
| kilograms per person | ||
| Beets | 0.7 | 0.9 |
| Carrots | 3.0 | 12.4 |
| Cucumbers | 0.7 | 1.3 |
| Green Beans | 0.7 | 1.3 |
| Green Peas | 3.0 | 1.3 |
| Onions | 3.1 | 5.7 |
| Tomatoes | 16.5 | 14.1 |
| Sources: Statistics Canada, Census of Agriculture, 1941; Census of Population, 1941 and 2011; and CANSIM table 001-0013 | ||
As mentioned previously, greenhouse vegetable production contributed to the increasing diversity of fresh vegetables available year-round in grocery stores. Nationally, 12.5 million square metres were reported in the 2011 Census, a figure corresponding to a tenfold increase since 1941. This growth has been particularly pronounced since 1991, driven in large part by expansion in Ontario followed by British Columbia (Chart 4).
Floriculture
The expansion of greenhouse area allocated to growing vegetables did not follow suit in the floriculture sector. Although greenhouse floriculture area increased by nearly 25 times over the past seven decades, from 506,000 square metres in 1941 to 8.6 million square metres in 2011, it however dropped by 7.4% (most notably in Ontario) in the most recent intercensal period. A number of factors can account for this decrease, including greater competition due to imported products from countries such as Ecuador, Colombia, and the United States, a higher Canadian dollar, weakening exports and rising production costs.
Evolution of a sector
Analysis of Census of Agriculture data over time makes clear that the Canadian horticulture sector has evolved considerably since the 1940s. In particular, areas that produce premium products capable of offsetting higher production costs, such as the production of greenhouse vegetables and grapes for wine have grown considerably. The development and growth of these horticultural sectors have been shaped by the Canadian climate, agricultural production techniques, and farmers’ ability to compete in domestic and global markets.
Note
- Weight per hectare calculation for 1940/41 is based on data from the 1941 Census of Agriculture which provides area in 1941 and production for 1940. Weight per hectare calculation for 2011 is based on area data from the 2011 Census of Agriculture and production for 2011 from the Fruit and Vegetable Survey.
- Date modified: