Canadian business counts, December 2016
Archived Content
Information identified as archived is provided for reference, research or recordkeeping purposes. It is not subject to the Government of Canada Web Standards and has not been altered or updated since it was archived. Please "contact us" to request a format other than those available.
Released: 2017-02-15
Nationally, there were 1,265,751 active businesses with employees in December. Provincially, Ontario reported the highest number of active businesses with employees, at 459,107, followed by Quebec (257,179), British Columbia (195,860) and Alberta (179,341).
The three industry sectors in Canada with the highest number of active businesses with employees were retail trade (145,435), construction (144,231) and professional, scientific and technical services (142,648).
In addition, there were 2,631,372 active businesses without employees and with annual revenues greater than $30,000.
Canadian business counts can be used to compare the number of active businesses by province, territory and city, and by industry category, including the food and beverage service industry.
Ontario has the strongest share of fast food establishments
In Canada, 50% of all establishments serving food and beverages were full-service establishments in December, while 44% were fast food establishments, and 6% were bars. These percentages varied slightly across the provinces. The proportion of fast food establishments ranged from 37% in Quebec to 48% in Ontario. The proportion of bars ranged from 4% in Ontario to 11% in Quebec.
British Columbia has highest provincial rate of fast food restaurants
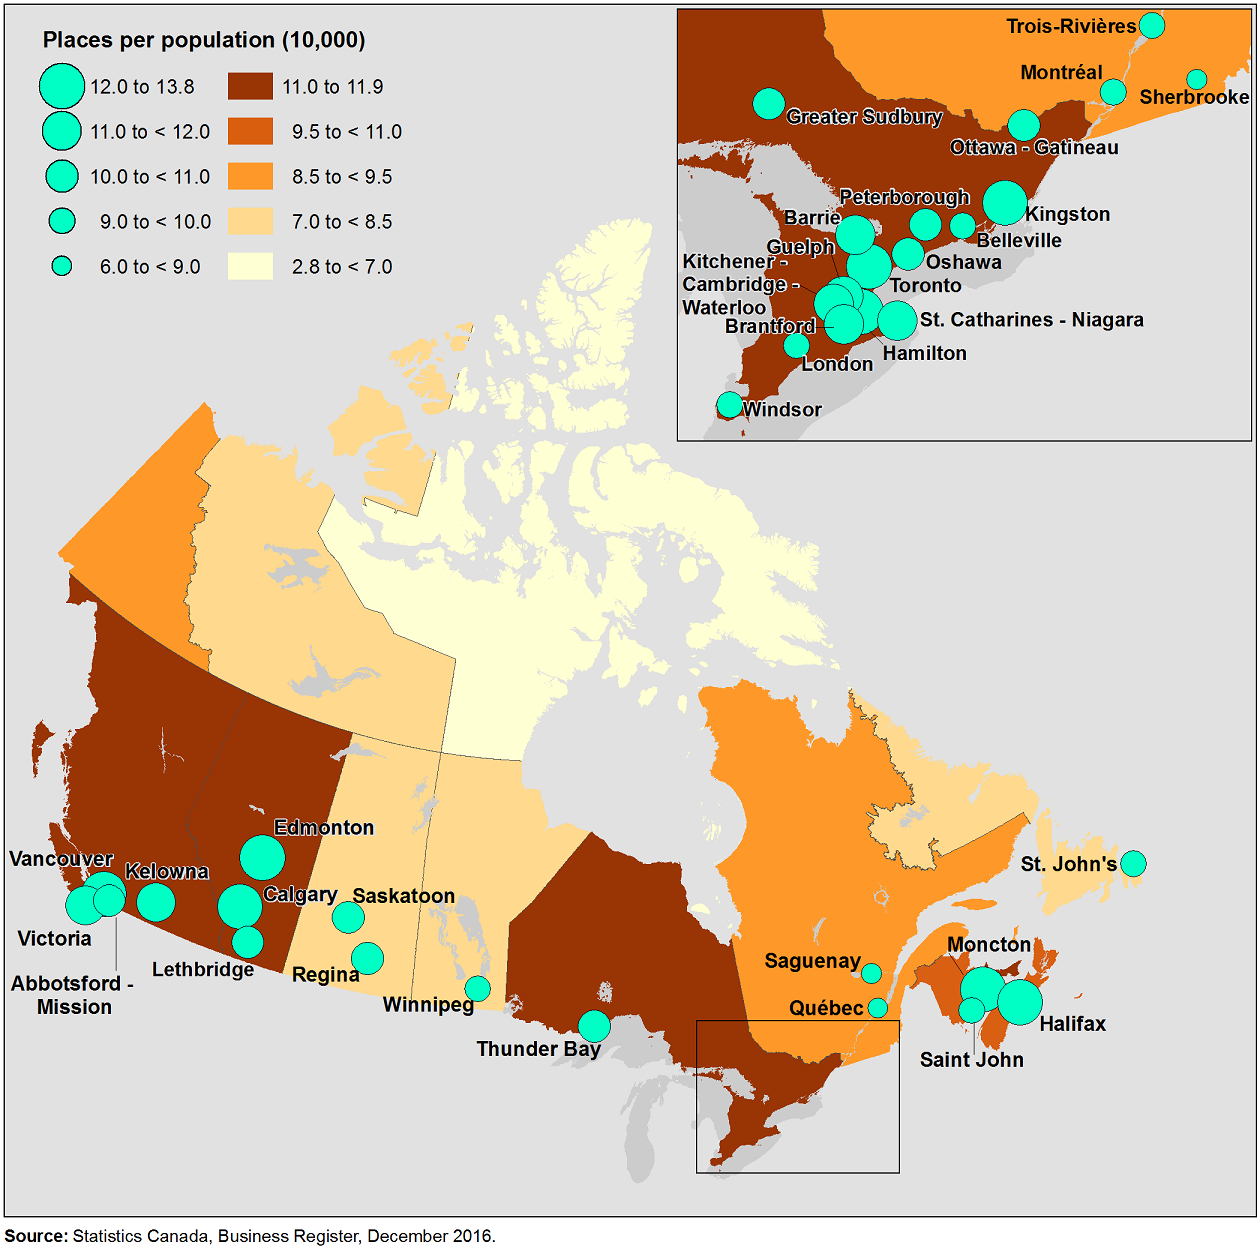
In December, there was an average of 10.3 fast food restaurants per 10,000 population in Canada. At the provincial level, British Columbia had the highest rate, at 11.6, followed by Ontario (11.4) and Prince Edward Island (11.1). The lowest rate of fast food restaurants was in Nunavut, at 2.7, followed by the Northwest Territories (6.8) and Newfoundland and Labrador (8.0).
Among census metropolitan areas, Toronto had the highest rate of fast food restaurants per 10,000 population, at 13.3, followed by Vancouver (13.0) and Calgary (12.6). The lowest rates were in Saguenay (6.0), followed by Sherbrooke (8.0) and Quebec (8.3).
Note to readers
Canadian business counts—previously called Canadian business patterns—provide counts of active businesses by industry classification and employment-size categories for Canada and the provinces and territories. Canadian business counts are based on the same criteria that were used to calculate Canadian business patterns.
Data are available in CANSIM tables 552-0005 and 553-0005.
The counts are compiled from the Business Register, Statistics Canada's central listing of Canadian businesses. They are based on the statistical concept of "location"—that is, each operating location is separately counted, including cases where one business comprises multiple locations. For example, a retail business with 10 stores represents 10 businesses in the Canadian business counts. Generally, among all Canadian businesses, 99% are single-location enterprises.
Changes to the Business Register's methodology or business industrial classification strategies can bring about increases or decreases in the number of active businesses reported in the Canadian business counts. As a result, the data do not represent changes in the business population over time. Statistics Canada recommends users not to use the data as a time series.
The figures released today reflect a significant downward correction to the number of holding companies, due to a re-coding of units in this industrial category.
Products
Custom data products for other geographic levels can be ordered on a cost-recovery basis. Data prior to December 2011 are also available upon request on a cost-recovery basis.
Contact information
For more information, contact us (toll-free 1-800-263-1136; 514-283-8300; STATCAN.infostats-infostats.STATCAN@canada.ca).
To order custom data, or to enquire about the concepts, methods or data quality of this release, contact Alex Côté (613-854-1676; alex.cote@canada.ca), Statistical Registers and Geography Division.
- Date modified:


