
A year in stats

Statistics Canada does not write the headlines—but our information often ends up there. The most important monthly indicators (GDP, labour force, and CPI) are anticipated by business reporters. Other figures and studies also cause the news media to sit up and take notice. Sometimes StatCan's data are particularly topical or revealing, or contradict expectations.
In 2015, one story made big news without the agency releasing any data. In November, the return of the mandatory long-form census was announced. It was reinstated in time for May 2016—when data for the next census will be collected—and StatCan will continue to fulfill its mandate by providing data that will help build stronger communities.
We do not decide what information will be picked up by the media, but we notice when our data become part of the national conversation. Here are some highlights from 2015: the releases that got people talking or informed the national debate. Also included are a few innovations in data gathering that have not received much coverage, but that offer a glimpse into the future of data in Canada.
Population aging is accelerating
In September, StatCan announced that, for the first time, people aged 65 and older outnumbered children aged 14 and younger in Canada. According to population estimates from July 1, 2015, people aged 65 and older made up 16.1% of the population, while those aged 14 and younger made up 16.0%. It is a gap that will likely increase in the coming decades, driven by aging baby boomers.
Statistics Canada also reported that 5.4 million Canadians provided care to a senior with a long-term condition or disability in 2012. Of these, 16% lived with the person receiving the care.
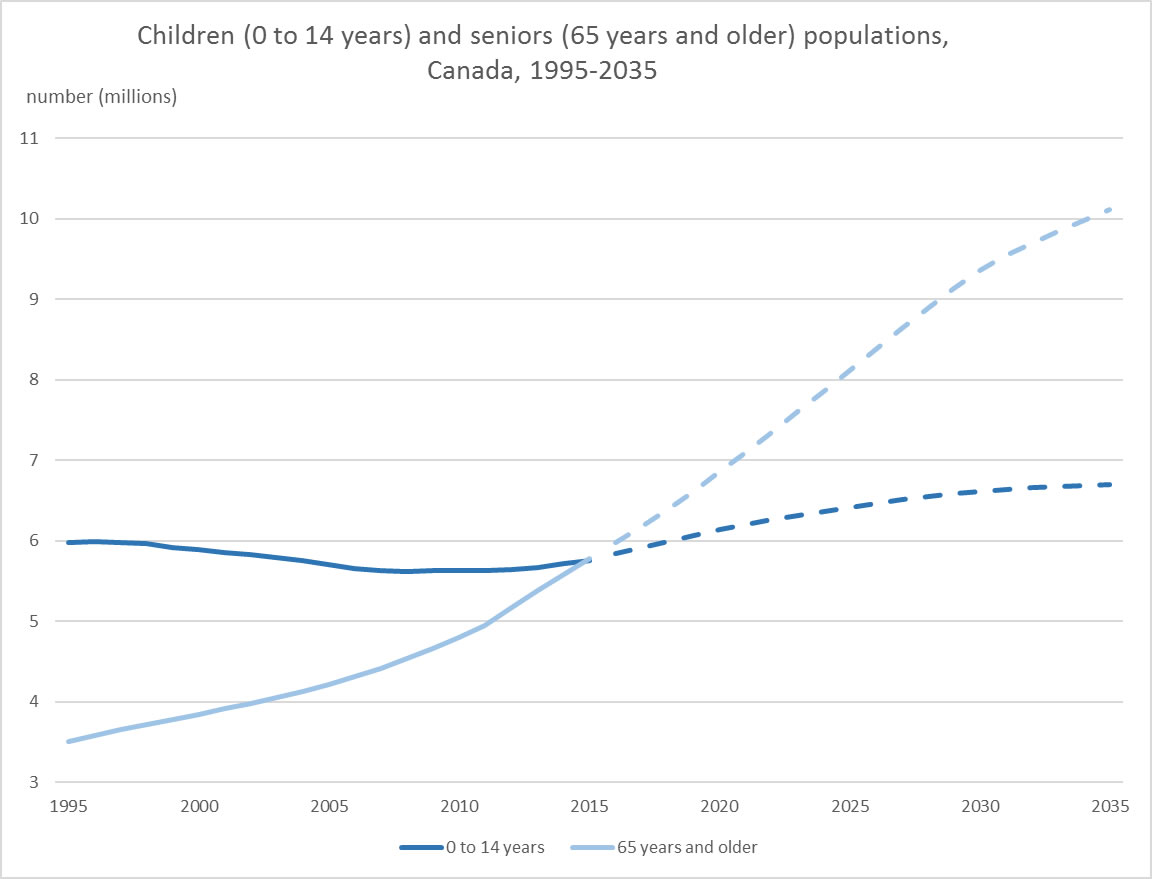
Source: Statistics Canada, Population estimates and projections programs.
Description for Chart 1
| 0 to 14 years | 65 years and older | |
|---|---|---|
| 1971 | 6,433,266 | 1,762,410 |
| 1972 | 6,338,993 | 1,807,417 |
| 1973 | 6,239,352 | 1,854,964 |
| 1974 | 6,143,346 | 1,904,453 |
| 1975 | 6,059,860 | 1,957,075 |
| 1976 | 5,960,649 | 2,022,589 |
| 1977 | 5,866,050 | 2,089,429 |
| 1978 | 5,754,160 | 2,155,461 |
| 1979 | 5,645,471 | 2,230,103 |
| 1980 | 5,572,981 | 2,305,748 |
| 1981 | 5,532,688 | 2,376,963 |
| 1982 | 5,525,527 | 2,441,456 |
| 1983 | 5,523,089 | 2,498,882 |
| 1984 | 5,518,549 | 2,563,287 |
| 1985 | 5,504,577 | 2,648,433 |
| 1986 | 5,485,595 | 2,736,563 |
| 1987 | 5,525,270 | 2,839,294 |
| 1988 | 5,574,803 | 2,928,736 |
| 1989 | 5,654,765 | 3,027,789 |
| 1990 | 5,729,712 | 3,124,160 |
| 1991 | 5,795,560 | 3,212,488 |
| 1992 | 5,872,423 | 3,291,224 |
| 1993 | 5,926,056 | 3,366,144 |
| 1994 | 5,960,979 | 3,434,488 |
| 1995 | 5,974,508 | 3,506,480 |
| 1996 | 5,985,864 | 3,579,003 |
| 1997 | 5,978,234 | 3,652,227 |
| 1998 | 5,959,301 | 3,720,120 |
| 1999 | 5,920,200 | 3,779,726 |
| 2000 | 5,884,966 | 3,843,678 |
| 2001 | 5,855,404 | 3,912,290 |
| 2002 | 5,830,330 | 3,980,081 |
| 2003 | 5,794,962 | 4,051,665 |
| 2004 | 5,754,140 | 4,127,579 |
| 2005 | 5,699,402 | 4,205,501 |
| 2006 | 5,654,379 | 4,309,958 |
| 2007 | 5,626,575 | 4,412,638 |
| 2008 | 5,620,562 | 4,532,605 |
| 2009 | 5,623,556 | 4,661,110 |
| 2010 | 5,624,472 | 4,796,143 |
| 2011 | 5,627,661 | 4,950,310 |
| 2012 | 5,642,867 | 5,165,385 |
| 2013 | 5,671,763 | 5,380,608 |
| 2014 | 5,709,962 | 5,584,592 |
| 2015 | 5,749,396 | 5,780,926 |
| 2016 | 5,840,125 | 5,974,734 |
| 2017 | 5,912,636 | 6,176,829 |
| 2018 | 5,988,365 | 6,389,290 |
| 2019 | 6,060,446 | 6,616,648 |
| 2020 | 6,135,535 | 6,857,021 |
| 2021 | 6,205,075 | 7,097,422 |
| 2022 | 6,265,448 | 7,346,332 |
| 2023 | 6,315,564 | 7,601,243 |
| 2024 | 6,363,824 | 7,856,303 |
| 2025 | 6,411,911 | 8,116,789 |
| 2026 | 6,460,706 | 8,380,379 |
| 2027 | 6,507,634 | 8,631,495 |
| 2028 | 6,549,826 | 8,886,464 |
| 2029 | 6,585,410 | 9,130,942 |
| 2030 | 6,615,178 | 9,354,123 |
| 2031 | 6,639,542 | 9,539,080 |
| 2032 | 6,659,110 | 9,693,762 |
| 2033 | 6,674,644 | 9,837,490 |
| 2034 | 6,687,001 | 9,978,138 |
| 2035 | 6,697,098 | 10,115,398 |
Victimization rates are falling
In 2014, just under one in five Canadians 15 years and older (approximately 5.6 million people) reported that they or their household had been the victim of a crime. This proportion is down from 2004, when just over one-quarter of Canadians reported having been the victim of a crime. Victimization rates for almost every type of crime, including violent crime, have declined since 2004.
However, only one-third of these crimes were reported to the police. Crimes resulting in injuries or involving weapons were more likely to be reported, as were crimes that resulted in a financial loss of $1,000 or more. Sexual assault remains heavily underreported, at only 5%.
For the first time, StatCan released homicide data with information on the Aboriginal identity of victims and accused
In 2014, police services in Canada began reporting to Statistics Canada complete data for Aboriginal identity of victims and accused people for both men and women. In November 2015, StatCan reported that in 2014, Aboriginal people were victims of homicide at a rate that was about six times higher than that of non-Aboriginal people (7.20 victims per 100,000 Aboriginal people versus 1.13 victims per 100,000 non-Aboriginal people).
Job vacancies and wages
A new Job Vacancy and Wage Survey was launched in 2015, with first quarter results released in August. This survey marks the first time Statistics Canada has provided job vacancy information by detailed occupation, skill level sought, and by economic region. Results from the Job Vacancy and Wage Survey, in addition to other data sources, will support decision making by job seekers, students, employers and policy-makers.
You won't have to remember how much money you made in 2015
In April, Statistics Canada announced that during the 2016 Census of Population, the agency will be using income data retrieved from personal income tax and benefits files to replace the income questions asked on the long-form questionnaire in previous censuses. Using these data makes it easier for Canadians to respond to the census questionnaire and means that income information for the 2016 Census will be the most accurate in the history of the census.
Speaking of money...
In December, Statistics Canada released figures showing a record level of household debt. In the third quarter of 2015, households had roughly $1.64 of debt for every dollar of disposable income.
The news followed analysis of debt and asset patterns among Canadian families from the Survey of Financial Security. In 2012, 71% of all Canadian families had at least some debt, and, among these families, the median figure was $60,100—up from $36,700 in 1999 (in 2012 constant dollars). At the same time, Canadians' household assets grew to record levels, largely the result of gains in real estate. From 1999 to 2012, the average wealth (or net worth) of Canadian families increased by 73%—from $319,800 to $554,100 (in 2012 constant dollars).
News about Canadians' health, nutrition and life satisfaction
Most school-aged children and youth in Canada are not getting enough physical activity to meet current guidelines. In 2012 and 2013, among school-aged children between the ages of 5 and 17, 13% of boys and 6% of girls were getting an average of at least 60 minutes of moderate-to-vigorous physical activity daily, as recommended in the Canadian Physical Activity Guidelines for children and youth.
According to the data from the same survey, more than 4 in 10 Canadians had an Omega-3 Index level that indicated they may be at an elevated risk for coronary heart disease.
About 1.1 million Canadian households experienced food insecurity in 2011–2012, meaning that they did not have the variety or quantity of food they needed, because of lack of money. Among off-reserve First Nations people aged 12 years and older, 22% lived in households that experienced food insecurity in 2012, three times the proportion of non-Aboriginal people (7%).
New data on life satisfaction by economic region were developed, providing a picture of how satisfied Canadians across the country are with their life as a whole. The data suggest that from 2009 to 2013, most Canadians were generally satisfied with their life. On average, residents in St. John's, Trois-Rivières and Saguenay were most satisfied with their life, while those in Vancouver, Toronto and Windsor were least satisfied.
Downturn in the energy (oil) sector
As an oil-producing nation, Canada's economic well-being is tied to energy prices. In 2015, the drop in global oil prices had a substantial effect on Canada's oil and gas sector. According to the Industrial Product Price Index, prices of energy and petroleum products decreased 24.2% from September 2014 to September 2015.
Overall, the mining, quarrying, and oil and gas extraction sector declined 8.2% in terms of GDP between September 2014 and September 2015. Support activities for mining and oil and gas extraction were hit even harder, falling 49.3% over the same period.
The downturn in the energy sector was largely responsible for a downturn in the Canadian economy as a whole in the first two quarters of 2015. In 2015, the economy contracted every month from January to May. An upturn in June was not large enough to prevent two consecutive quarters of negative growth.
Drilling for new data
Linking the economy and the environment, Statistics Canada released a landmark study—the first of its kind in Canada—that recognized subsoil mineral and energy resources as a natural capital input into the production process. The inclusion of the use of natural resources in the growth accounting framework will allow expanded analysis on questions regarding sustainable growth, economic potential and long-run growth prospects, and will inform discussions on the link between the environment and economic policy.
Also on the economic side, experimental data became available on gross domestic product generated in the six census metropolitan areas with populations of one million or more: Toronto, Montréal, Vancouver, Calgary, Edmonton and Ottawa–Gatineau.
Who is watching my soybeans grow?
Statistics Canada, in collaboration with Agriculture and Agri-Food Canada, is using satellite imagery—remote sensing—to track field crop production. The new yield model will provide accurate crop production information for Canadian farmers, at a reduced cost. Farmers will also no longer be asked to respond to the September Farm Survey.
This replacement of a traditional survey with a model that incorporates remote sensing, agroclimatic data and survey data to model reliable crop yield estimates is a world first for a statistical agency. This confirms Statistics Canada's role as a world leader in statistical methods, research and innovation.
We are living in an increasingly global economy
As Canadian companies increasingly engage in the global economy, there is a growing demand for information to better understand how businesses are expanding internationally and the benefits and consequences for Canada.
During 2015, Statistics Canada released new information highlighting the impact that foreign-owned corporations have on the Canadian economy. In 2011, foreign-owned multinational corporations operating in Canada accounted for 12% of all employment and 44% of all goods exports.
In 2012, Canadian-owned corporations operating abroad employed 1.25 million employees and generated global sales of $519 billion.
What are we really worth?
In 1936, Canada's top statistician R.H. Coats noted in the publication Canada's National Wealth that "Our national wealth, as here understood, is the sum total of our physical assets." In 2015, Statistics Canada extended the coverage of the quarterly national balance sheet to go beyond physical assets and include, for the first time, the value of natural resources such as subsoil assets and timber.
By this new measure, Canada's national wealth declined by $190.4 billion to $9,205.0 billion at the end of September. This was mainly attributable to a $285.4 billion decrease in the value of natural resource wealth as energy prices fell in the third quarter.
National net worth declined 1.3% or $129.4 billion from the second quarter to $9,493.0 billion at the end of the third quarter. On a per capita basis, national net worth decreased 1.7% to $263,800.
Looking forward
As 2015 ends, Statistics Canada is gearing up to communicate with more than 14 million households for the 2016 Census. Recruitment of 35,000 field staff begins in January, and early enumeration takes place in northern communities in February and March.
Keep an eye on The Daily, StatCan's official release publication, for all of the latest statistical releases. There are new data and studies available every morning on the state of Canada's economy and society.
Login/register to post comments.
Recent posts
-
 1904 people recommended this
 -
 2551 people recommended this
 -
 2925 people recommended this