
How to measure changes in Canada's grocery bill
Say you're at the grocery store and you notice that your favourite brand of peanut butter is 50 cents cheaper than the last time you bought it. But when you look carefully, you see that the jar is 25mL smaller. The next biggest size costs a little less per mL, and as far as you can tell, it is the same size and price as the month before. So, is your favourite peanut butter getting cheaper, or more expensive? What about the price of peanut butter in general?
Price check!
Statistics Canada's price collectors have that information. This team records the prices of approximately 100,000 consumer items each month, in 40 cities across Canada. Of these items, almost half (45,000) are food. Price collectors visit approximately 500 food retailers, from small local shops to big box supermarkets, and methodically record the prices of items on the shelves.
They also record any changes in size, weight, number of units in a box and other features that determine what consumers are actually paying for, and note when an item is discontinued.
Richard Evans, Director of Consumer Prices Division at Statistics Canada, describes how they work: "The price collectors operate very independently. They go down the aisles, most people think they're other shoppers. They just go around, check prices, and they're out."
Creating an index
Collectively, these data are used to create the Consumer Price Index (CPI), Canada's main measure of changes in price levels. The index is also used to inform monetary policy and adjust tax brackets, rent controls, transfer payments and pensions.
The CPI basket contains the vast majority of goods and services that Canadians buy. Each item in the basket is weighted according to its relative importance in the consumer's overall spending. For instance, in any given month, people spend less on chocolate compared with vegetables. As a result, vegetables are weighted more heavily in calculating the index.
"The CPI is in the best shape it's ever been," explains Mr. Evans. "We update the basket every two years. We've significantly increased the quality of the sample, the monthly pricing that we do. We've done that by adding more prices. We also have a better method for selecting stores, and for selecting products in stores, than we used to have. We're world leaders in this area."
To make sure that the data are free from manipulation, Statistics Canada is tight-lipped about which items are on the list and which stores its price collectors visit. Individual collectors also have some latitude in choosing what brands to include in their data. (Chances are your favourite peanut butter is being measured several times.)
What matters most in the data collection is that the price collectors are consistent: they visit the same roster of stores, at the same day and week each month, and record the price of the same brands. This way, the data can be compared month over month, and will not be affected by inconsistent methodology.
More expensive groceries...than in 2015
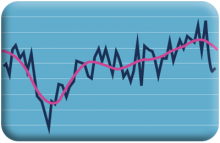
What the data show is that, from a historical perspective, overall food prices have been increasing at a relatively steady rate for many years. With very few exceptions, across all types of food purchased from stores, and all provinces and territories, consumers are paying more than they did in the past. In fact, in May 2017 they were paying about 41% more than in 2002. At the same time, the All-items CPI increased 30%, so during those 15 years, food prices climbed noticeably faster.
However, Canadians caught a small break in 2017. The overall price of food purchased from stores was slightly lower in May 2017 than in May 2016.
Description for Chart 1
| All-items | Food purchased from stores | |
|---|---|---|
| Source: Statistics Canada, CANSIM table 326-0020. | ||
| May 2002 | 99.7 | 100.3 |
| June 2002 | 99.9 | 100.7 |
| July 2002 | 100.5 | 100.6 |
| August 2002 | 100.9 | 99.7 |
| September 2002 | 100.9 | 98.4 |
| October 2002 | 101.2 | 97.7 |
| November 2002 | 101.5 | 99.9 |
| December 2002 | 101.1 | 100.7 |
| January 2003 | 102.0 | 101.8 |
| February 2003 | 102.8 | 101.5 |
| March 2003 | 103.1 | 101.7 |
| April 2003 | 102.4 | 101.7 |
| May 2003 | 102.5 | 102.1 |
| June 2003 | 102.5 | 102.4 |
| July 2003 | 102.6 | 102.3 |
| August 2003 | 102.9 | 101.0 |
| September 2003 | 103.1 | 100.0 |
| October 2003 | 102.8 | 99.6 |
| November 2003 | 103.1 | 101.0 |
| December 2003 | 103.2 | 102.2 |
| January 2004 | 103.3 | 102.2 |
| February 2004 | 103.5 | 101.9 |
| March 2004 | 103.9 | 102.1 |
| April 2004 | 104.1 | 101.7 |
| May 2004 | 105.0 | 102.8 |
| June 2004 | 105.1 | 104.2 |
| July 2004 | 105.0 | 104.0 |
| August 2004 | 104.8 | 103.6 |
| September 2004 | 105.0 | 102.8 |
| October 2004 | 105.2 | 103.4 |
| November 2004 | 105.6 | 104.8 |
| December 2004 | 105.4 | 105.4 |
| January 2005 | 105.3 | 104.8 |
| February 2005 | 105.7 | 104.4 |
| March 2005 | 106.3 | 105.0 |
| April 2005 | 106.6 | 106.2 |
| May 2005 | 106.7 | 106.4 |
| June 2005 | 106.9 | 106.7 |
| July 2005 | 107.1 | 106.3 |
| August 2005 | 107.5 | 106.0 |
| September 2005 | 108.4 | 104.5 |
| October 2005 | 107.9 | 104.9 |
| November 2005 | 107.7 | 105.6 |
| December 2005 | 107.6 | 106.5 |
| January 2006 | 108.2 | 107.8 |
| February 2006 | 108.0 | 107.4 |
| March 2006 | 108.6 | 107.2 |
| April 2006 | 109.2 | 106.9 |
| May 2006 | 109.7 | 107.7 |
| June 2006 | 109.5 | 108.2 |
| July 2006 | 109.6 | 108.5 |
| August 2006 | 109.8 | 108.4 |
| September 2006 | 109.2 | 107.8 |
| October 2006 | 109.0 | 108.2 |
| November 2006 | 109.2 | 109.1 |
| December 2006 | 109.4 | 108.9 |
| January 2007 | 109.4 | 110.2 |
| February 2007 | 110.2 | 112.5 |
| March 2007 | 111.1 | 111.9 |
| April 2007 | 111.6 | 111.7 |
| May 2007 | 112.1 | 112.0 |
| June 2007 | 111.9 | 111.9 |
| July 2007 | 112.0 | 111.4 |
| August 2007 | 111.7 | 110.6 |
| September 2007 | 111.9 | 109.2 |
| October 2007 | 111.6 | 108.9 |
| November 2007 | 111.9 | 109.8 |
| December 2007 | 112.0 | 110.1 |
| January 2008 | 111.8 | 111.4 |
| February 2008 | 112.2 | 111.8 |
| March 2008 | 112.6 | 111.6 |
| April 2008 | 113.5 | 112.7 |
| May 2008 | 114.6 | 114.1 |
| June 2008 | 115.4 | 115.3 |
| July 2008 | 115.8 | 116.2 |
| August 2008 | 115.6 | 116.4 |
| September 2008 | 115.7 | 116.5 |
| October 2008 | 114.5 | 116.8 |
| November 2008 | 114.1 | 119.7 |
| December 2008 | 113.3 | 120.0 |
| January 2009 | 113.0 | 121.0 |
| February 2009 | 113.8 | 121.8 |
| March 2009 | 114.0 | 122.2 |
| April 2009 | 113.9 | 122.1 |
| May 2009 | 114.7 | 122.5 |
| June 2009 | 115.1 | 122.7 |
| July 2009 | 114.7 | 122.7 |
| August 2009 | 114.7 | 121.5 |
| September 2009 | 114.7 | 119.7 |
| October 2009 | 114.6 | 119.3 |
| November 2009 | 115.2 | 121.2 |
| December 2009 | 114.8 | 121.5 |
| January 2010 | 115.1 | 122.1 |
| February 2010 | 115.6 | 122.5 |
| March 2010 | 115.6 | 123.1 |
| April 2010 | 116.0 | 122.6 |
| May 2010 | 116.3 | 122.8 |
| June 2010 | 116.2 | 122.8 |
| July 2010 | 116.8 | 123.4 |
| August 2010 | 116.7 | 123.0 |
| September 2010 | 116.9 | 122.3 |
| October 2010 | 117.4 | 121.8 |
| November 2010 | 117.5 | 122.4 |
| December 2010 | 117.5 | 123.2 |
| January 2011 | 117.8 | 124.4 |
| February 2011 | 118.1 | 124.9 |
| March 2011 | 119.4 | 127.6 |
| April 2011 | 119.8 | 127.1 |
| May 2011 | 120.6 | 128.0 |
| June 2011 | 119.8 | 128.7 |
| July 2011 | 120.0 | 129.7 |
| August 2011 | 120.3 | 129.2 |
| September 2011 | 120.6 | 128.2 |
| October 2011 | 120.8 | 127.8 |
| November 2011 | 120.9 | 129.4 |
| December 2011 | 120.2 | 129.4 |
| January 2012 | 120.7 | 130.5 |
| February 2012 | 121.2 | 130.8 |
| March 2012 | 121.7 | 130.1 |
| April 2012 | 122.2 | 130.1 |
| May 2012 | 122.1 | 131.2 |
| June 2012 | 121.6 | 131.0 |
| July 2012 | 121.5 | 132.2 |
| August 2012 | 121.8 | 132.1 |
| September 2012 | 122.0 | 130.0 |
| October 2012 | 122.2 | 130.2 |
| November 2012 | 121.9 | 131.3 |
| December 2012 | 121.2 | 131.0 |
| January 2013 | 121.3 | 131.3 |
| February 2013 | 122.7 | 133.1 |
| March 2013 | 122.9 | 132.3 |
| April 2013 | 122.7 | 132.3 |
| May 2013 | 123.0 | 132.9 |
| June 2013 | 123.0 | 132.7 |
| July 2013 | 123.1 | 132.8 |
| August 2013 | 123.1 | 133.0 |
| September 2013 | 123.3 | 131.4 |
| October 2013 | 123.0 | 131.1 |
| November 2013 | 123.0 | 132.7 |
| December 2013 | 122.7 | 132.0 |
| January 2014 | 123.1 | 132.6 |
| February 2014 | 124.1 | 134.4 |
| March 2014 | 124.8 | 134.6 |
| April 2014 | 125.2 | 134.6 |
| May 2014 | 125.8 | 136.2 |
| June 2014 | 125.9 | 137.0 |
| July 2014 | 125.7 | 137.0 |
| August 2014 | 125.7 | 136.0 |
| September 2014 | 125.8 | 135.3 |
| October 2014 | 125.9 | 135.1 |
| November 2014 | 125.4 | 137.1 |
| December 2014 | 124.5 | 137.6 |
| January 2015 | 124.3 | 139.7 |
| February 2015 | 125.4 | 140.2 |
| March 2015 | 126.3 | 140.2 |
| April 2015 | 126.2 | 140.0 |
| May 2015 | 126.9 | 141.8 |
| June 2015 | 127.2 | 141.9 |
| July 2015 | 127.3 | 141.8 |
| August 2015 | 127.3 | 141.4 |
| September 2015 | 127.1 | 140.6 |
| October 2015 | 127.2 | 141.3 |
| November 2015 | 127.1 | 142.2 |
| December 2015 | 126.5 | 143.2 |
| January 2016 | 126.8 | 146.1 |
| February 2016 | 127.1 | 146.4 |
| March 2016 | 127.9 | 145.8 |
| April 2016 | 128.3 | 144.6 |
| May 2016 | 128.8 | 143.8 |
| June 2016 | 129.1 | 143.1 |
| July 2016 | 128.9 | 143.4 |
| August 2016 | 128.7 | 142.0 |
| September 2016 | 128.8 | 139.3 |
| October 2016 | 129.1 | 138.4 |
| November 2016 | 128.6 | 139.4 |
| December 2016 | 128.4 | 139.2 |
| January 2017 | 129.5 | 140.3 |
| February 2017 | 129.7 | 140.4 |
| March 2017 | 129.9 | 140.6 |
| April 2017 | 130.4 | 140.9 |
| May 2017 | 130.5 | 142.1 |
So why does my bill seem so high?
Several factors influence how much individuals and families pay for food—and how much they feel they are paying for food. The CPI accounts for some of these factors, such as regional differences in price, changing prices of different food products, and seasonal price fluctuations for certain items.
There is also the very human tendency, called the negativity bias, to be more affected by negative changes—in this case, higher prices—than positive ones. "We tend to remember bad news," says Mr. Evans. "Bad things strike us. And we tend not to focus so much on price declines."
Indexing the prices of so many consumer goods in Canada is a tricky art, and one that involves a great deal of knowledge. But Statistics Canada has been refining the CPI for 90 years, perfecting its methods and formula to create an increasingly precise measure. This makes the CPI Canada's most authoritative source of changes in price levels.
Login/register to post comments.
Recent posts
-
 1904 people recommended this
 -
 2551 people recommended this
 -
 2925 people recommended this