
Actual expenditures
Departmental spending trend graph
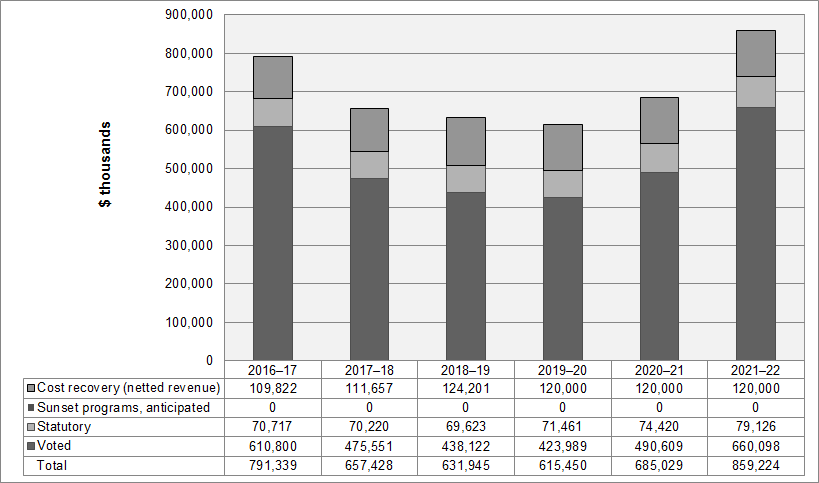
Description - Departmental spending trend graph
| Fiscal year | 2016–17 | 2017–18 | 2018–19 | 2019–20 | 2020–21 | 2021–22 |
|---|---|---|---|---|---|---|
| Cost recovery (netted revenue) | 109,822 | 111,657 | 124,201 | 120,000 | 120,000 | 120,000 |
| Sunset programs, anticipated | 0 | 0 | 0 | 0 | 0 | 0 |
| Statutory | 70,717 | 70,220 | 69,623 | 71,461 | 74,420 | 79,126 |
| Voted | 610,800 | 475,551 | 438,122 | 423,989 | 490,609 | 660,098 |
| Total | 791,339 | 657,428 | 631,945 | 615,450 | 685,029 | 859,224 |
| Core Responsibilities and Internal Services | 2018–19 Main Estimates | 2018–19 Planned spending | 2019–20 Planned spending | 2020–21 Planned spending | 2018–19 Total authorities available for use | 2018–19 Actual spending (authorities used) | 2017–18 Actual spending (authorities used) | 2016–17 Actual spending (authorities used) |
|---|---|---|---|---|---|---|---|---|
| Statistical information | 489,924,625 | 489,924,625 | 551,104,432 | 621,955,372 | 587,888,560 | 559,559,344 | 585,363,802 | 713,862,461 |
| Internal Services | 66,104,652 | 66,104,652 | 64,345,374 | 63,073,510 | 71,969,503 | 72,385,465 | 72,064,636 | 77,476,859 |
| Total gross expenditures | 556,029,277 | 556,029,277 | 615,449,806 | 685,028,882 | 659,858,063 | 631,944,809 | 657,428,438 | 791,339,320 |
| Respendable revenue | -120,000,000 | -120,000,000 | -120,000,000 | -120,000,000 | -124,200,719 | -124,200,719 | -111,657,283 | -109,822,159 |
| Total net expenditures | 436,029,277 | 436,029,277 | 495,449,806 | 565,028,882 | 535,657,344 | 507,744,090 | 545,771,155 | 681,517,161 |
Statistics Canada is funded from two sources: direct parliamentary appropriations and cost-recovery activities. Statistics Canada has the authority to generate respendable revenue related to two streams: statistical surveys and related services, and custom requests and workshops. In recent years, respendable cost-recovery revenue has contributed between $110 million and $124 million annually to the agency's total resources. A large portion of these respendable revenues comes from federal departments to fund specific statistical projects.
The graph and table above illustrate that voted spending peaked in 2016–17 when the 2016 Census of Population and the 2016 Census of Agriculture field collection activities were conducted. This is followed by a significant decrease in subsequent years as census activities wind down. Spending will begin to ramp up and peak again in 2021–22 when the 2021 Census field collection activities are conducted. This pattern is typical for the agency because of the cyclical nature of the Census Program. Funding for the 2021 Census was approved in 2018–19, with the first year of funding being 2018–19.
The difference between 2018–19 actual spending and 2018–19 total authorities available for use is largely attributable to how the agency strategically manages its investments. The agency has leveraged the operating budget carry-forward mechanism to manage the cyclical nature of normal program operations toward the agency's strategic priorities and to ensure the quality of its existing programs is maintained. Throughout the year, forecast lapses and amounts carried forward are managed centrally, by priority, within the statistical information Core Responsibility. The difference is also attributable to a Statistical Survey Operations pay equity settlement and shifts in its original payment timeline.
Spending on Internal Services temporarily increased in 2016–17 as the agency invested in modernizing its work environment to offset government-wide space pressures and help increase staff mobility. Spending in 2017–18 and 2018–19 included additional internal information technology support and pressures related to the Government of Canada pay system.
| Core Responsibilities and Internal Services | 2018–19 Actual gross spending | 2018–19 Actual gross spending for specified purpose accounts | 2018–19 Actual revenues netted against expenditures | 2018–19 Actual net spending (authorities used) |
|---|---|---|---|---|
| Statistical information | 559,559,344 | 0 | -124,200,719 | 435,358,625 |
| Internal Services | 72,385,465 | 0 | 0 | 72,385,465 |
| Total gross expenditures | 631,944,809 | 0 | -124,200,719 | 507,744,090 |
Statistics Canada has generated $124.2 million in respendable revenue from the sale of statistical products and services.
Actual human resources
| Core Responsibilities and Internal Services | 2016–17 Actual full-time equivalents | 2017–18 Actual full-time equivalents | 2018–19 Planned full-time equivalents | 2018–19 Actual full-time equivalents | 2019–20 Planned full-time equivalents | 2020–21 Planned full-time equivalents |
|---|---|---|---|---|---|---|
| Statistical information | 5,829 | 5,417 | 4,666 | 5,498 | 5,501 | 5,823 |
| Internal Services | 653 | 607 | 594 | 645 | 566 | 554 |
| Total gross expenditures | 6,482 | 6,024 | 5,260 | 6,143 | 6,067 | 6,377 |
| Respendable revenue | -1,078 | -1,251 | -1,001 | -1,380 | -1,321 | -1,266 |
| Total net expenditures | 5,404 | 4,773 | 4,259 | 4,763 | 4,746 | 5,111 |
Similar to trends seen in actual spending, full-time equivalent (FTE) changes from year to year are largely explained by the cyclical nature of the Census Program. Activity peaked in 2016–17 for the 2016 Census of Population and 2016 Census of Agriculture, then dropped sharply in subsequent years. Activity will begin to ramp up and peak again in 2021–22, when the 2021 Census of Population and 2021 Census of Agriculture field collection activities are conducted.
Approximately 200 public servant FTEs based across Canada outside the National Capital Region (NCR) are included in net expenditure FTEs. Also included are approximately 847 interviewer FTEs (representing approximately 1,800 interviewers) outside the NCR. Of the 847 interviewer FTEs, 357 are working on respendable revenues. These interviewers are part-time workers whose assigned workweeks are determined by the volume of collection work available; they are hired under the Statistics Act, by the authority of the Minister of Innovation, Science and Economic Development. Interviewers are covered by two separate collective agreements and are employed through Statistical Survey Operations. Many of Statistics Canada's main outputs rely heavily on data collection and on the administration of these activities, which takes place in the regional offices.
Expenditures by vote
For information on Statistics Canada's organizational voted and statutory expenditures, consult the Public Accounts of Canada 2018–2019.
Government of Canada spending and activities
Information on how Statistics Canada's spending aligns with the Government of Canada's spending and activities is available in the GC InfoBase.
Financial statements and financial statements highlights
Financial statements
Statistics Canada's financial statements (unaudited) for the year ended March 31, 2019, are available on the Statistics Canada website.
The agency uses the full accrual accounting method to prepare and present its annual financial statements, which are part of the departmental result reporting process. However, spending authorities presented in the previous sections of this report remain on an expenditure basis. A reconciliation between the bases of reporting is available in Note 3 of the financial statements.
Financial statements highlights
| Financial information | 2018–19 Planned results | 2018–19 Actual results | 2017–18 Actual results | Difference (2018–19 Actual results minus 2018–19 Planned results) | Difference (2018–19 Actual results minus 2017–18 Actual results) |
|---|---|---|---|---|---|
| Total expenses | 652,609,282 | 689,548,230 | 711,998,792 | 36,938,948 | -22,450,562 |
| Total revenues | 112,513,235 | 123,544,327 | 111,482,637 | 11,031,092 | 12,061,690 |
| Net cost of operations before government funding and transfers | 540,096,047 | 566,003,903 | 600,516,155 | 25,907,856 | -34,512,252 |
A more detailed Future-Oriented Statement of Operations, March 31, 2019 (unaudited) and associated notes are available on the agency's website.
The net cost of operations before government funding and transfers was $566.0 million, a decrease of $34.5 million (5.7%) from $600.5 million in 2017–18. This decrease in expenses is mainly due to salary payments made upon the ratification of collective agreements and software purchases, both made in 2017–18, and offset by an increase in revenue related to cost-recovery projects.
The difference between actual and planned net costs for 2018–19 is $25.9 million (4.8%). Expenses were $36.9 million higher than anticipated. The majority of this variance is related to spending that was approved during the fiscal year, such as 2021 Census of Population, 2021 Census of Agriculture and other new initiatives. Revenues were $11.0 million higher than anticipated because a higher number of contracts were signed, mainly with federal government departments.
For more information on the distribution of expenses by program and type, please see the two charts below.
Gross expenditures by Core Responsibility
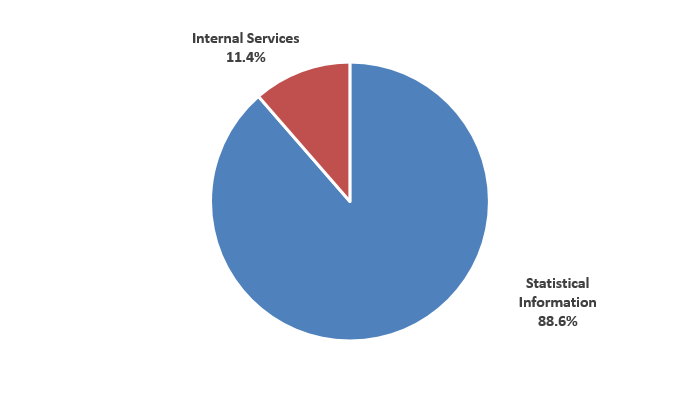
Total expenses, including respendable revenue and services provided without charge by federal government departments, were $689.5 million in 2018–19. These expenses comprised $610.9 million (88.6%) for statistical information and $78.6 million for Internal Services.
Gross expenditures by type
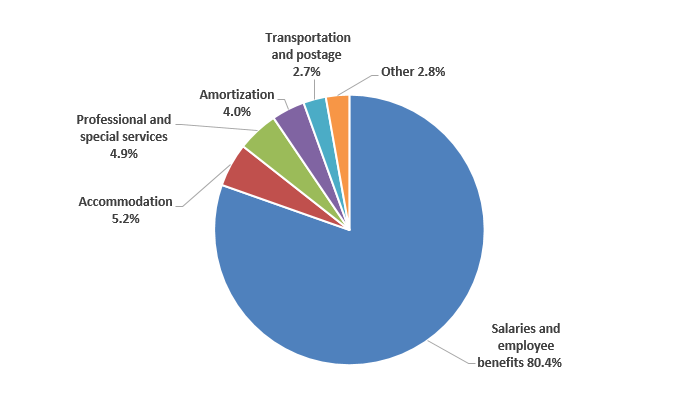
Statistics Canada spent $689.4 million in 2018–19. These expenses comprised $554.5 million (80.4%) for salaries and employee benefits, $35.9 million (5.2%) for accommodation, $33.9 million (4.9%) for professional and special services, $27.4 million (4.0%) for amortization, $18.8 million (2.7%) for transportation and postage, and $18.9 million (2.8%) for other expenses.
| Financial information | 2018–19 | 2017–18 | Difference (2018–19 minus 2017–18) |
|---|---|---|---|
| Total net liabilities | 126,839,355 | 133,873,770 | -7,034,415 |
| Total net financial assets | 70,423,190 | 70,807,866 | -384,676 |
| Departmental net debt | 56,416,165 | 63,065,094 | -6,648,929 |
| Total non-financial assets | 170,257,252 | 162,972,807 | 7,284,445 |
| Departmental net financial position | 113,841,087 | 99,906,903 | 13,934,184 |
The departmental net financial position was $113.8 million at the end of 2018–19, an increase of $13.9 million from $99.9 million in 2017–18.
The increase in the departmental net financial position is explained by two factors: first, a decrease in the Statistical Survey Operations pay equity liability as a result of payments and a software licence renewal that was made in 2017–18, and second, an increase in tangible capital assets related to the capitalization of software under development.
For more information on the distribution of the balances in the statements of financial position, please see the two charts below.
Assets by type
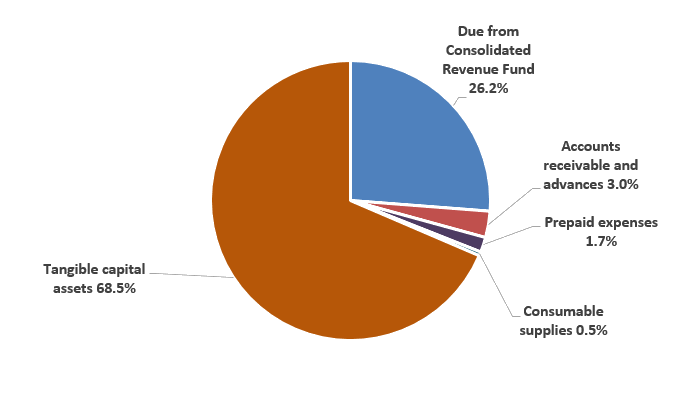
Total assets, including financial and non-financial assets, were $240.6 million at the end of 2018–19. Tangible capital assets represented the largest portion of assets, at $164.9 million (68.5%). They consisted of informatics software ($99.9 million), software under development ($46.9 million), leasehold improvements ($15.4 million) and other assets ($2.7 million). The remaining portion of assets comprised $63.1 million (26.2%) for amounts due from the Consolidated Revenue Fund, $7.3 million (3.0%) for accounts receivable and advances, $4.2 million (1.7%) for prepaid expenses, and $1.1 million (0.5%) for consumable supplies.
Liabilities by type
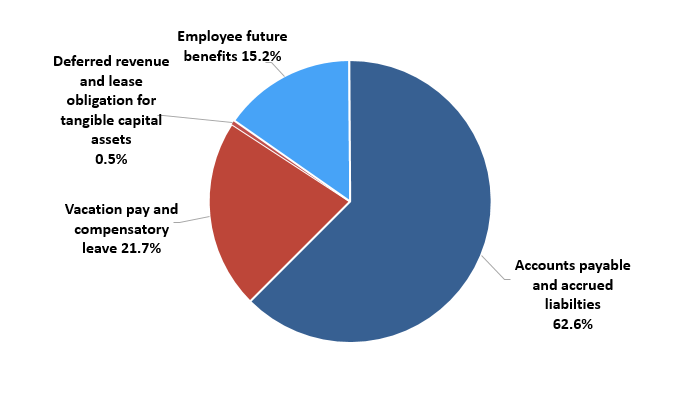
Total liabilities were $126.8 million at the end of 2018–19. Accounts payable and accrued liabilities made up the largest portion of liabilities, at $79.3 million (62.6%). They consisted of accounts payable to external parties ($24.6 million), accounts payable to other federal government departments and agencies ($9.3 million), and accrued salaries and wages ($45.4 million). The next largest portion was vacation pay and compensatory leave, at $27.6 million (21.7%). Employee future benefits made up $19.3 million (15.2%). The remaining portion was composed of deferred revenue and lease obligation for tangible capital assets, at $0.6 million (0.5%).