
Evaluation Report
December 2020
- The report in short
- What is covered
- What we learned
- User experience
- Design, delivery and implementation
- How to improve the program
- Management response and action plan
- Appendix A – Evaluation types
- Appendix B – Virtual Data Lab business case
- Appendix C – Business outcome indicators and performance measurement method
- Appendix D – Statistics Canada's modernization initiative
- Appendix E – Contingency plans
Acronyms and abbreviations
- BoC
- Bank of Canada
- CCT
- Confidentiality Classification Tool
- CDER
- Canadian Centre for Data Development and Economic Research
- CMHC
- Canada Mortgage and Housing Corporation
- CRMS
- Client Relationship Management System
- DAaaS
- Data Analytics as a Service
- DAD
- Data Access Division
- DataLab
- Virtual Data Lab (pseudonym)
- FRDC
- Federal Research Data Centre
- IT
- Information technology
- KPI
- Key performance indicator
- MAP
- Microdata Access Portal
- MRC
- Microdata research contract/ agreement
- RDC
- Research data centre
- TIRAC
- Trusted Individual Responsible for Access Controls
- UX
- User experience
- VDL
- Virtual Data Lab
- vFRDC
- Virtual Federal Research Data Centre
The report in short
The Data Access Division (DAD) is responsible for providing microdata access to researchers outside Statistics Canada and for maintaining the repository of all deemed employees of the agency. This includes providing support, expertise and standards of data provision to subject-matter areas within Statistics Canada, and ensuring that the confidentiality of information is protected in all microdata access agreements.
Building on the foundation of the research data centres (RDCs) and the Canadian Centre for Data Development and Economic Research (CDER), Statistics Canada created the Virtual Data Lab (VDL) pilot that—in its end state—will provide remote access to detailed anonymized social and business microdata for research and analysis through a secure cloud-based interface. The VDL aims to increase the number of researchers that use Canadian data, increase the number of data holdings that users can access, modernize existing IT infrastructure, develop shared-risk partnerships and move existing operations to a cloud-based architecture.
The evaluation was conducted by Statistics Canada's Evaluation Division in accordance with the Treasury Board's Policy on Results (2016) and Statistics Canada's Risk-Based Audit and Evaluation Plan (2019–20 to 2023–24). The objective of the evaluation was to provide a neutral, evidence-based assessment of program alignment with identified user needs. The evaluation reviewed whether existing VDL assessments conducted within the agency were adequately comprehensive in their coverage, and whether findings and recommendations from these assessments were integrated into the design, delivery, strategic planning and implementation of the VDL project. In addition, the evaluation assessed the extent to which performance measurement and risk assessment frameworks have been implemented.
The evaluation methodology consisted of a document review, key informant interviews with Statistics Canada professionals working in the DAD and Digital Solutions Field, and additional lines of inquiry, where applicable.
It should be noted that the conducting phase of the evaluation, during which all data for the report were collected, was completed before the COVID-19 pandemic. As a result, the findings and recommendations do not consider the activities or decisions that took place after March 2020.
Key findings and recommendations
Issue 1: user experience
Question 1
To what extent are existing DataLab assessments comprehensive in considering all users, identifying user needs and aligning project planning with desired outcomes?
Findings
The assessments are comprehensive in their coverage of existing users and in identifying user needs and feedback trends that can be used to inform strategic planning, particularly among federal government and academic users.
Collectively, existing assessments are comprehensive in their coverage of all project dimensions and in alignment with the desired outcomes set out in project planning and framework documents.
Issue 2: design, delivery and implementation
Question 2
To what extent has information from completed assessments been integrated into the DataLab project?
Findings
Assessments of user experience (UX), privacy and security have been leveraged to inform strategies and planning. However, timelines for delivery were not always clear.
The DAD performed an international scan of national statistical offices (NSOs) with similar capabilities and programs to determine best practices and assess similar program offerings around the world.
Question 3
To what extent have performance measurement and risk assessment frameworks been implemented?
Findings
Performance indicators have been articulated and work to improve them is ongoing.
A risk management framework exists and active risk management is ongoing. Contingency planning and a clarification of responsibilities would be useful.
Recommendation 1
The Assistant Chief Statistician, Strategic Engagement (Field 4), should ensure that given the level of complexity and dependence on other parts of the agency, contingencies and clearer timeframes be articulated for activities.
Recommendation 2
The Assistant Chief Statistician, Strategic Engagement (Field 4), should ensure that governance mechanisms are in place that effectively manage horizontal activities in a holistic manner including the clear establishment and understanding of roles and responsibilities.
Update
Since the end of the reference period for the evaluation (March 2020), the VDL Project team has launched and completed a variety of initiatives to meet urgent emerging needs and at the same time accelerate project development. These initiatives included: launching an interim access solution to facilitate COVID-19 research; piloting a cloud environment for a project on opioids with federal partners; working closely with governing bodies to approve frameworks and approaches; and creating and revising key documents such as contracts and agreements to ensure they reflected the VDL framework and governance. The team also updated the project plan to account for progress in several areas including the development and implementation of a corporate client relationship management system and initiated working groups to address issues such as onboarding roles and responsibilities.
What is covered
The evaluation was conducted in accordance with Treasury Board's Policy on Results(2016) and Statistics Canada's Integrated Risk-based Audit and Evaluation Plan (2019–20 to 2023–24). In support of decision-making, accountability and improvement, the main objective of the evaluation was to provide a neutral, evidence-based assessment of the Virtual Data Lab (VDL) pilot. Because of the status of the project at the time of the evaluation, a formative approach was employed.Footnote 1
Data Access Division
The Data Access Division (DAD) is responsible for governing access to confidential microdata to researchers—and deemed employees—outside and within Statistics Canada. This includes providing support, expertise and standards of data provision to subject-matter areas within the agency and ensuring that the confidentiality of the information is protected in all microdata access agreements. The DAD delivers microdata access through various programs based on the type of data requested, user-specific needs, the purpose of accessing the dataset and the sensitivity level of the requested data file. The provision of microdata access is then administered through a continuum in accordance with organizational security requirements and the sensitivity of the data files.
| Less sensitive, self-service access | Most sensitive, restricted access | ||
|---|---|---|---|
| Data Liberation Initiative | Access to public use microdata files | Real Time Remote Access | Research data centres, the Canadian Centre for Data Development and Economic Research, Virtual Data Labs |
| This is a subscription-based service that provides unlimited access to available, anonymized and non-aggregated data in the collection. | Postsecondary institutions and Statistics Canada partnerships provide faculty members and students with unlimited access to a variety of public use data and geographic files. | This is an online service that allows users to run SAS programs in real time using data located in a secured location. | Secure Statistics Canada physical environments are made available to accredited researchers and federal government employees to access anonymized microdata for research purposes, ensuring that all personal information is removed from outputs. |
As part of Statistics Canada's ongoing efforts to support its modernization agenda (Appendix D), it developed the Confidentiality Classification Tool (CCT)—a corporate tool for classifying confidential data. The CCT is a short questionnaire that generates a standard confidentiality classification along a continuum of risk (a score from 0 to 9). CCT scores are used to determine the nature and degree of confidentiality protections Statistics Canada employs in its information holdings. In particular, this tool is used to determine access conditions for trusted external data users, such as VDL partner organizations and researchers, through an access management framework adapted from the Five Safes framework developed by the United Kingdom's Office for National Statistics (this is a holistic approach to data protection that goes beyond information technology [IT] and physical site protection).
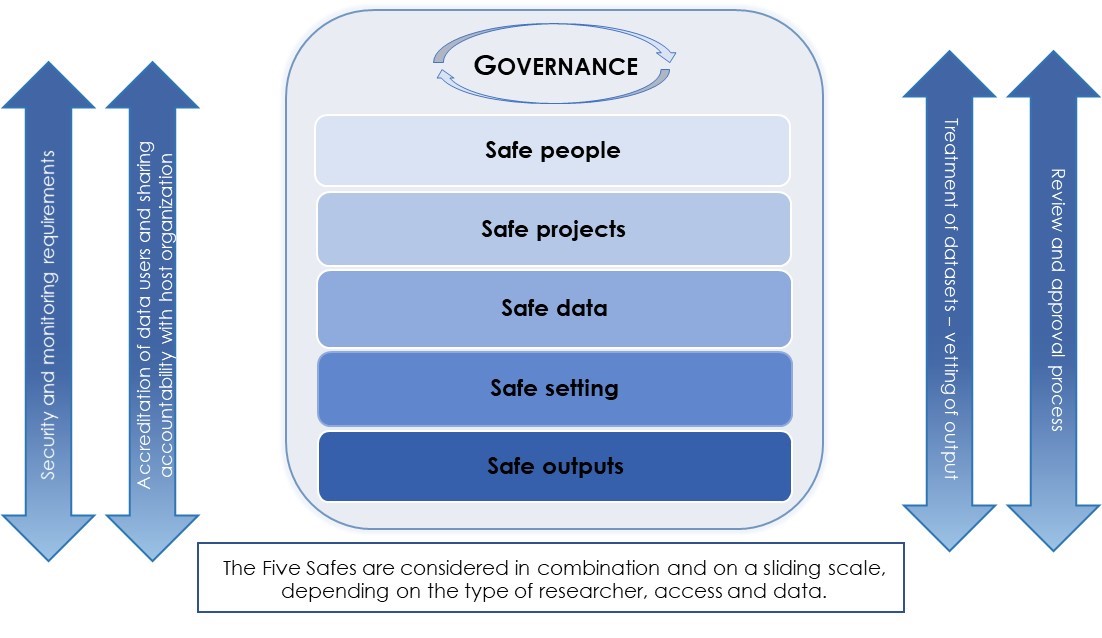
Description for Figure 1 - Five Safes framework
The figure depicts the five safes along with four elements that tie the safes together. Overarching the safes is the governance. The five safes are considered in combination and on a sliding scale, depending on the type of researcher, access and data.
The five safes are:
- Safe people - Can the users be trusted to use it in an appropriate manner?
- Safe projects - Is the use of the data appropriate?
- Safe data - Is there a risk of disclosure?
- Safe setting - Does the access facility prevent unauthorized use?
- Safe outputs - Are the statistical results non-disclosive?
The four elements are:
- Security and monitoring requirements
- Accreditation of data users and sharing accountability with the host organization
- Treatment of datasets – vetting of outputs
- Review and approval process
| Safe people | Can the users be trusted to use it in an appropriate manner? |
|---|---|
| Safe projects | Is the use of the data appropriate? |
| Safe data | Is there a risk of disclosure? |
| Safe setting | Does the access facility prevent unauthorized use? |
| Safe outputs | Are the statistical results non-disclosive? |
Virtual Data Lab pilot project
Building on the foundation of the research data centres (RDC) and the Canadian Centre for Data Development and Economic Research (CDER), Statistics Canada created the VDL pilot that—in its end state—will provide remote access to detailed, anonymized social and business microdata for research and analysis through a secure cloud-based interface. The VDL business case outlined the following key outcomes (Appendix B):
- Enhance UX when accessing anonymized microdata.
- Leverage new technology, methods and data.
- Apply risk management practices (to optimize data accessibility with protective measures).
- Increase collaboration and partnerships between data users and providers.
- Build analytical and research capacity.
- Support stronger evidence-based decision-making.
The first prototype of the VDL is the virtual Federal Research Data Centre, which is located at the Canada Mortgage and Housing Corporation (CMHC) headquarters in Ottawa. With new partnerships being developed, this shared-risk model will be expanded to additional partner agencies and their users. The CMHC facility—where deemed employees are provided secure access to anonymized data—is being used to test UX, access and security protocol, starting with a designated certified room similar to an RDC and moving into regulated access for approved CMHC employees to use anonymized research files in separate authorized workspaces. The VDL pilot will evolve gradually toward remote cloud-based access once Statistics Canada's cloud infrastructure becomes available.
The anonymized data used by CMHC researchers are housed on secure Statistics Canada servers and authorized researchers are required to use Statistics Canada secure encrypted devices to connect to these central servers through Virtual Desktop Infrastructure. Less sensitive (i.e., with a lower CCT score) information may be accessed in authorized workspaces, while more sensitive anonymized data (CCT 8) are accessible only within the designated certified room.
The VDL project will also be expanding to include the Bank of Canada (BoC) and the Health Portfolio (Opioid Pathfinder Project), with additional partnerships planned.
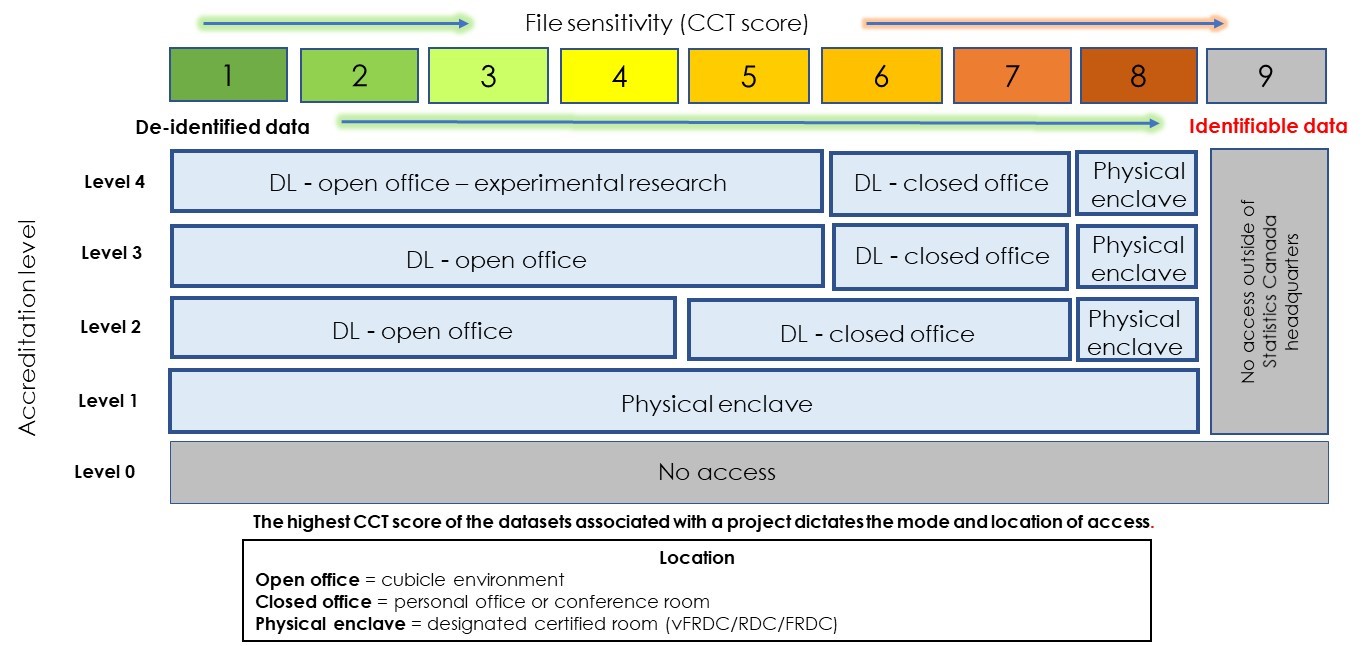
Description of Figure 2 - Location of access and file sensitivity for deemed employees
The figure depicts the types of locations of access mapped against the accreditation level and file sensitivity level (Confidentiality Classification Tool [CCT] score).
In the figure, the file sensitivity (CCT score) ranges from 1 to 9 with 1 being the lowest and 9 the highest.
The accreditation level ranges from level 0 to level 4 with level 0 being the lowest.
Location access includes open office (cubicle environment), closed office (personal office or conference room), physical enclave (designated certified room including virtual federal research data centre, research data centre, and federal research data centre).
In terms of location access:
- A accreditation level of 0 provides no access regardless the file sensitivity score
- For file sensitivity scores of 9, there is no access outside of Statistics Canada headquarters regardless accreditation level
- Level 1 accreditation means access via physical enclave for file sensitivity scores of 1 to 8
- Level 2 accreditation means access via open office for file sensitivity scores 4 and below, closed office for file sensitivity scores 5 to 7, and physical enclave for a file sensitivity score of 8
- Level 3 accreditation means access via open office for file sensitivity scores 5 and below, closed office for file sensitivity scores 6 and 7, and physical enclave for a file sensitivity score of 8
- Level 4 accreditation means access via open office (experimental research) for file sensitivity scores of 5 and below, closed office for file sensitivity scores 6 and 7, and physical enclave for a file sensitivity score of 8
The highest CCT score of the datasets associated with a project dictates the mode and location of access.
The length and complexity of the process to apply for access to Statistics Canada microdata files, as well as the limitations on use and outputs, are dependent on the sensitivity level (CCT score) of the data file to which access has been requested (and granted) and—therefore—vary by access program. The RDC, CDER and VDL programs provide access to more sensitive data files, so application, access and use protocols are similar across these programs.
Progress toward the implementation of a cloud-based platform for VDL users is contingent on progress made by other Statistics Canada areas, namely the Data Analytics as a Service (DAaaS) and IT teams, as well as partner agencies and cloud services. With relatively short timelines, triangulated efforts made by all teams involved must continue to properly test the product and UX, minimize risks, and work toward key project management timelines, deliverables and thresholds.
In summary, the VDL is leveraging new and innovative tools, as well as testing new delivery platforms and formats. The project is based on an incremental approach to project development and leveraging lessons learned to adapt and improve quickly.
Evaluation
The scope of the evaluation was established based on a document review and meetings with DAD experts. The following areas were identified for review:
Evaluation issues and questions
User experience
- To what extent are existing DataLab assessments comprehensive in considering all users, identifying user needs and aligning project planning with desired outcomes?
Design, delivery and implementation
- To what extent has information from completed assessments been integrated into the DataLab project?
- To what extent have performance measurement and risk assessment frameworks been implemented?
Guided by a formative evaluation approach, two main collection methods were used:
- Internal stakeholder interviews
Semi-structured interviews with the DAD and Digital Solutions - Document review
Review of internal agency documents
Four main limitations were identified, and mitigation strategies were employed:
| Limitations | Mitigation strategies |
|---|---|
| Because of the large number of (potential) users, the perspectives gathered through user research and assessments may not be fully representative. | User feedback was considered from a variety of assessments with differing primary objectives. Evaluators were able to identify consistent trends across these reports, which were representative of general user needs from all current and prospective user groups. |
| User feedback may contain self-reported bias, which occurs when individuals who are reporting on their own activities portray themselves in a more positive light. | By reviewing information from a variety of assessments with different scopes, evaluators were able to find consistent overall patterns and trends on which to elaborate. |
| Evidential documents are not always available. | Additional documentation was requested and provided as required and key DAD staff were interviewed to fill any gaps. |
| The program has not yet worked with corporate services to develop key performance indicators (KPIs) and associated risk profiles. |
Using a formative evaluation approach allowed evaluators to assess indicators and intermediate objectives—a requirement of the Departmental Project Management Framework project approval guidelines (project plan and charter). Desired outcomes for the pilot were identified and repeated throughout the document review process and could be used as an informal evaluation framework. |
The conducting phase of the evaluation, during which all data for the report were collected, was completed before the COVID-19 pandemic. As a result, the findings and recommendations do not consider the activities or decisions that took place after March 2020.
What we learned
User experience
Evaluation question
To what extent are existing DataLab assessments comprehensive in their coverage of all users, in identifying user needs and aligning project planning with desired outcomes?
The assessments are comprehensive in their coverage of existing users and in identifying user needs and feedback trends that can be used to inform strategic planning, particularly among federal government and academic users.
The large majority of existing user feedback was sourced from federal government researchers. Additional insights were provided by RDC employees who were able to confirm that the trends identified in existing assessments align with those of RDC user feedback (mainly academic users and government employees). Although these assessments are representative of current microdata users, future user needs assessments should be expanded to cover a broader range of users and identify project opportunities and prospective partners.
For improved understanding of VDL user requirements, the team will need to extend its coverage of user consultations to provincial and territorial governments to assess the unique needs of these key potential user groups, in adherence with the intended business outcome of establishing new and increased data partnerships with other government departments. In the longer term, consulting private industry and civil society organizations would provide additional insights on the user needs of these groups, in alignment with the long-run business outcome of increasing the number of researchers that use Canadian data and microdata files.
| User type | Users consulted, by assessment | ||||
|---|---|---|---|---|---|
| DAaaS UX journey maps | Internal risk review | CMHC feedback | MAP usability testing | All | |
| Private | 2 | - | - | - | 2 |
| Federal government | 25 | 6 | 17 | 5 | 53 |
| Provincial government | 5 | - | - | - | 5 |
| Academic | 5 | - | - | - | 5 |
| Civil society | 3 | - | - | - | 3 |
| Total | 68 | ||||
Collectively, existing assessments are comprehensive in their coverage of all project dimensions and aligned with the desired outcomes set out in project planning and framework documents.
A review of the existing assessments found that the user process was covered effectively. Information was gathered on all seven steps, beginning with the proposal and ending with the vetting.
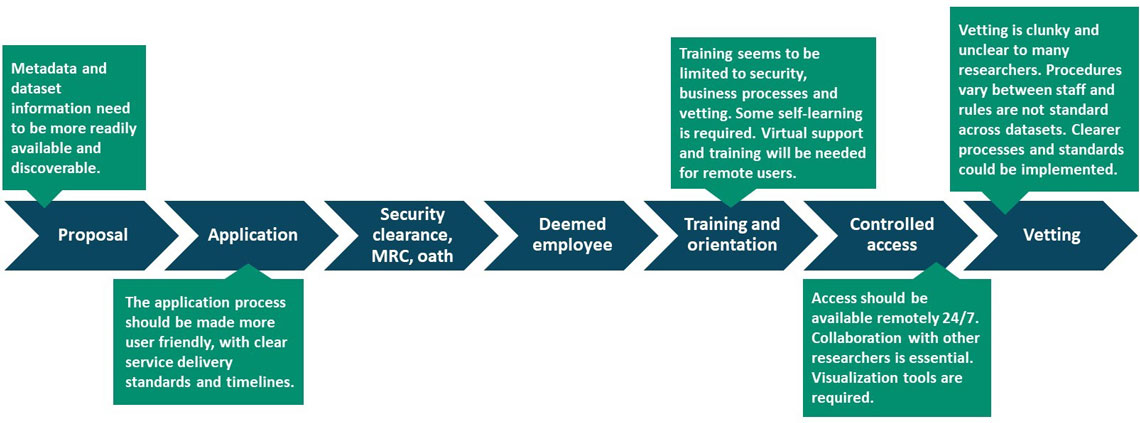
Description - Statistics Canada microdata access user process, user trends identified
The figure depicts the user process from start to finish:
- proposal
- application
- security clearance, MRC (microdata research agreement), and oath
- deemed employee
- training and orientation
- controlled access
- vetting
Five trends are identified:
- At the proposal step - metadata and dataset information need to be more readily available and discoverable.
- At the application step - the application process should be made more user friendly, with clear service delivery standards and timelines.
- At the training and orientation step - training seems to be limited to security, business processes and vetting. Some self-learning is required. Virtual support and training will be needed for remote users.
- At the controlled access step - access should be available remotely 24/7. Collaboration with other researchers is essential. Visualization tools are required.
- At the vetting step - vetting is clunky and unclear to many researchers. Procedures vary between staff and rules are not standard across datasets. Clearer processes and standards could be implemented.
The evaluation team identified areas of the microdata access process in which trends in user feedback were consistent, including increasing data discoverability, simplifying the proposal process, implementing modern and user-centric tools and support mechanisms, allowing collaboration between researchers within and across research projects, and improving the vetting process. These key areas were examined further in interviews with experts from the VDL team and the DAD.
In terms of alignment with the VDL desired outcomes, the evaluation found that the assessments covered four key outcomes sufficiently:
- Enhance UX when accessing anonymized microdata.
- Leverage new technology, methods and data.
- Apply risk management practices (to optimize data accessibility with protective measures).
- Increase collaboration and partnerships between data users and providers.
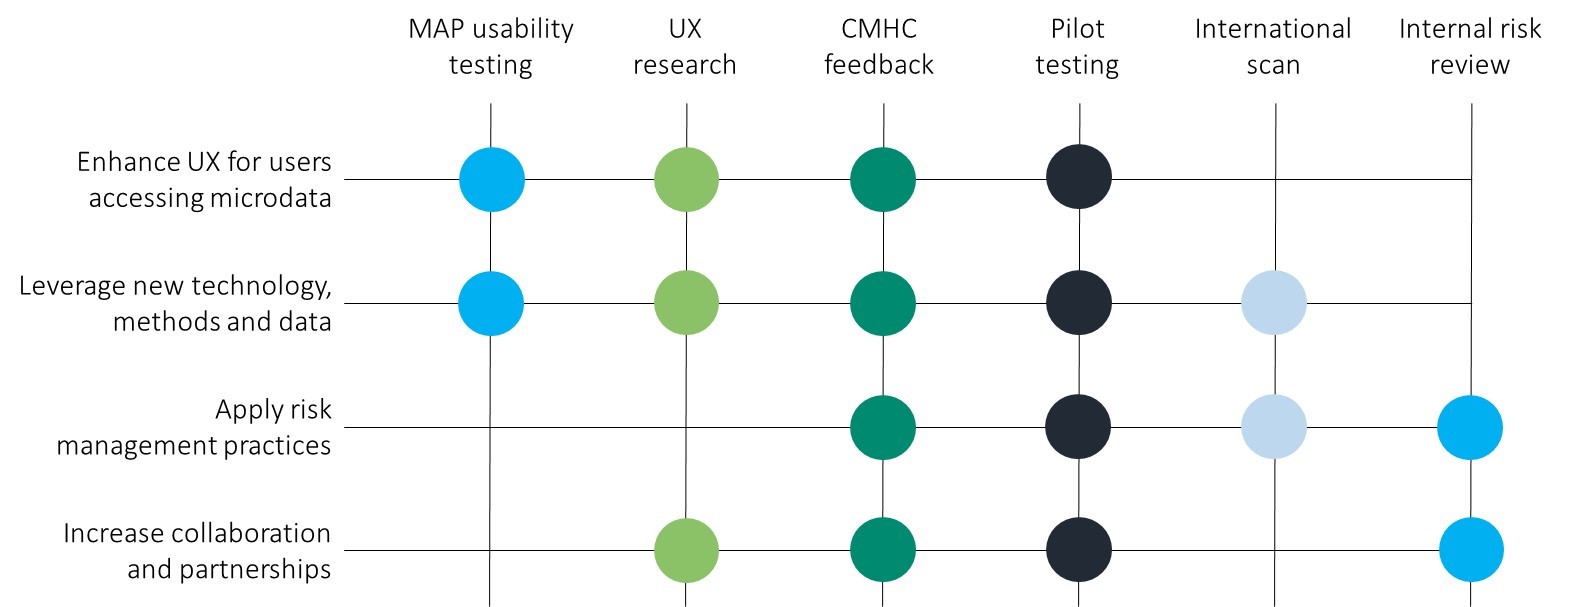
Description of Figure 4 - Alignment of assessments with Virtual Data Lab project outcomes
The figure depicts how the assessments align with the virtual data lab project outcomes. There are four project outcomes: enhance user experience (UX) for users accessing microdata; leverage new technology, methods and data; apply risk management practices; increase collaboration and partnerships. There are 6 assessments: MAP usability testing, UX research, CMHC feedback, pilot testing, international scan, internal risk review.
The outcomes are covered by the assessments as follows:
- Enhance user experience (UX) for users accessing microdata is covered by 4 assessments: MAP usability testing, UX research, CMHC feedback, pilot testing
- Leverage new technology, methods and data is covered by 5 assessments: MAP usability testing, UX research, CMHC feedback, pilot testing, international scan
- Apply risk management practices is covered by 4 assessments: CMHC feedback, pilot testing, international scan, internal risk review
- Increase collaboration and partnerships is covered by 4 assessments: UX research, CMHC feedback, pilot testing, internal risk review
| VDL outcome | Findings |
|---|---|
| Enhance the user experience when accessing anonymized microdata |
|
| Leverage new technology, methods and data |
|
| Apply risk management practices (to optimize data accessibility with protective measures) |
|
| Increase collaboration and partnerships between data users and providers |
|
Design, delivery and implementation
Evaluation question
To what extent has information from completed assessments been integrated into the DataLab project?
The evaluation considered whether findings of all assessments were leveraged to inform decision-making, project management and strategic planning, including the degree to which they were integrated into the development of tools and processes for the VDL. Assessment findings and recommendations have been integrated into VDL plans to a significant degree.
Assessments of UX, privacy and security have been leveraged to inform strategies and planning. However, timelines for delivery were not always clear.
The evaluation found that the VDL team—and the DAD more generally—has made a significant effort to consult users and test products prior to implementation. Assessments of user needs and UX research were leveraged to develop business requirements for the new MAP and Client Relationship Management System (CRMS). During the planning stages, the VDL team also performed an international scan to identify best practices that could be leveraged for the project, its services and framework.
Based on the UX assessments and discussions with RDC experts, the evaluation team was able to identify recurring trends in user feedback across the microdata access process. These have been further articulated below, including planned and proposed solutions.
| Microdata access process | User issue identified | Planned or proposed solution |
|---|---|---|
| Proposal for data discoverability | Researchers reported experiencing difficulties in determining which datasets to request and identifying which variables were available in each one. Improved discoverability and availability of metadata and documents, such as data dictionaries, codebooks and variable lists, would facilitate the proposal process for users, as they could be used to inform proposal writing and develop research plans. | The VDL team is working with key partners such as DAaaS, IT, Corporate Services, other units within the DAD and the Canadian Research Data Centre Network to implement a data discoverability tool. This process has been delayed because of the CRMS acquisition, which will act as the administrative back end of the MAP. The data discoverability function was included as a business requirement for the development of the MAP and CRMS. In the interim, the DAD is working with subject-matter areas to include variables in the dataset descriptions available through the Integrated Metadatabase. Timelines for a fully functioning data discoverability tool were not identified, but were considered to be more long term. |
| Application |
Users noted that the application process could be made more accessible with clear directions, as well as defined timelines of service standards with which they could better plan their research. The microdata access application process should be streamlined or automated, where possible, to reduce wait times and limit redundant or unnecessary processes that may strain resources. |
The MAP (user interface) is being developed to include specifications, such as register an account, modify information, upload or download documents, apply for and be assigned a CCT access score, join a project or invite team users, and save information securely. The MAP is currently being used for researcher applications, but will be expanded to cover other aspects of the microdata access process. The MAP was first user tested and updated before its rollout. Timelines for a final MAP were not identified. |
| Training | Training is limited to security, business processes and vetting with self-learning being necessary. Virtual support and training modules would be beneficial, especially once users work exclusively from the cloud platform. |
Training and orientation modules would be administered through the MAP and repeated at specific frequencies to ensure users are informed and aware of processes and policies. Timelines for this component of the MAP were identified during discussions as being short to medium term. |
| Controlled access |
UX could be improved through the implementation of a "one-stop-shop" MAP (with one set of login credentials, virtual training modules, project and security reminders, and a collaboration space for researchers). Access should also be available remotely on a 24/7 basis. |
The VDL team (DAD) plans to use the MAP to manage administrative processes, including the proposal, fees, training, support and vetting (currently limited to the proposal process). An additional planned MAP capability provides access to the VDL interface. The implementation of the MAP (in its full capacity) is contingent on a new CRMS that will support the VDL in managing user processes, as well as in extracting KPI data. The cloud interface will provide a centralized data access point and may eventually include a collaboration space for researchers, but this will require a review of the Policy on Microdata Access. As part of the planned shift toward data access through the cloud, users would also be able to access data from their personal device remotely, subject to the CCT score of the dataset for which they have been granted access. When data are deemed highly sensitive, researchers who must access their data from a secure facility or approved closed office space would be required to follow the security access protocol (business hours) of their respective organization. Timelines for the use of personal devices were not identified. |
| Vetting | Users described the vetting process as clunky and otherwise unclear or inconsistent. Procedures vary between staff and rules are not always standard across datasets. The vetting process should be streamlined or automated, where possible, to reduce inconsistencies and facilitate understanding among users, in particular to standardize training and approaches, and support users through vetting rules and the vetting process. |
The DAD is currently exploring tools and programs available to streamline this process. They are examining a system developed by another jurisdiction that—while limited in its ability to vet most VDL outputs—may be used as a basis upon which further development can take place. Vetting is being considered for inclusion in the MAP training modules to help increase consistency. Timelines for improved vetting processes were not articulated, but appear to be long term (one to two years or more). |
Overall, the evaluation found that the VDL team worked collaboratively with the DAaaS team to identify trends in UX and possible solutions (HMW statements). Although these statements were beneficial in presenting possible solutions, they were not included in project planning, nor were timelines established for their integration. An additional area for improvement in UX could come from formalized lessons learned over the first few months of the project rollout, especially as new partners are onboarded.
Lastly, because of the complex integrated nature of the project, timelines are heavily reliant on other areas of the agency. Some activities related to the MAP and cloud services are scheduled to take place in the near term, while others have been pushed to future iterations of the project. The timing of those activities and items being pushed was generally unclear.
The DAD performed an international scan of NSOs with similar capabilities and programs to determine best practices and assess similar program offerings worldwide.
The approach taken by the VDL team was developed by completing a point-in-time international scan of similar offerings among other NSOs. The use of the Five Safes framework came from this scan. Best practices of the NSOs in Australia, Denmark, Finland, France, Germany, Sweden and the United Kingdom were assessed when developing the possible format of the VDL, and its services align with international best practices from this point in time.
It would be beneficial for the VDL team to establish an international network of microdata access experts to share best practices proactively to replace point-in-time international scans that may miss key elements. In this way, the VDL team would remain informed of new and innovative approaches to microdata access that could be used or adopted.
Evaluation question
To what extent have performance measurement and risk assessment frameworks been implemented?
Performance indicators have been articulated and work to improve them is ongoing.
Members of the VDL team noted that, while the performance measurement framework and indicators are outlined in the business case and project plan, they should be viewed as preliminary (Appendix C). At the time of the evaluation, the DAD was set to begin working with internal performance measurement experts to develop divisional performance indicators. It was unclear whether this would include additional KPIs for the VDL project. The VDL team could work proactively with other DAD project teams to identify KPIs that balance outcomes at the divisional level while also monitoring the progress of the VDL project. In terms of monitoring, there was little indication that regular monitoring of progress against the indicators in the project plan was taking place.
A risk management framework exists and active risk management is taking place. Contingency planning and a clarification of responsibilities would be useful.
A comprehensive review of the business process and risk framework was completed in 2019 and documentation and regular reporting on risks take place through the Departmental Project Management Framework. Members of the VDL team noted that they will take an iterative approach to amending risks and proposed mitigations or response strategies as changes arise within the project and as they learn from partners and users, although no formal documentation was provided.
Risk management includes effective contingency planning as part of mitigation development. The evaluation found that the articulation of contingency plans could be improved. Some examples where such plans would be beneficial include the proposal and vetting processes (Appendix E). For example, changes to the proposal process are highly dependent on both a new CRMS and MAP. However, no contingencies were found in the case of either of them being delayed or not meeting requirements. For the vetting process, a standard operating procedure could be established in the short term to improve consistency and clarity.
Lastly, the evaluation found that a clarification of responsibilities would be useful, which is particularly important given the complexity of the project and the strong dependency on partners. In particular, it was noted that, while there was a difference between what was considered a VDL project responsibility and what was considered a DAD responsibility, it was unclear how and when things were intended to be shared, who was ultimately making decisions, and how the work would be distributed.
Performance measurement and risk management
- The Data Access Division (DAD) and the virtual data lab (VDL) team will work with internal performance measurement experts to develop and implement a logic model.
- As part of existing assessments, a comprehensive review of security procedures and processes of the virtual Federal Research Data Centre (vFRDC) was completed.
- Service-centric metrics and reporting were identified as a mandatory and high-priority business requirement for a new Client Relationship Management System (CRMS).
- The DAD will take a responsive approach to amending policies and directives as needs arise. This includes amending the risk management framework to reflect risks from the transition to remote access.
How to improve the program
Recommendation 1
The Assistant Chief Statistician, Strategic Engagement (Field 4), should ensure that given the level of complexity and dependence on other parts of the agency, contingencies and clearer timeframes be articulated for activities.
Recommendation 2
The Assistant Chief Statistician, Strategic Engagement (Field 4), should ensure that governance mechanisms are in place that effectively manage horizontal activities in a holistic manner including the clear establishment and understanding of roles and responsibilities.
Management response and action plan
Recommendation 1
The Assistant Chief Statistician, Strategic Engagement (Field 4), should ensure that given the level of complexity and dependence on other parts of the agency, contingencies and clearer timeframes be articulated for activities.
Management response
Management agrees with the recommendation.
The VDL project will maintain evergreen plans, schedules and contingencies. An enhanced tracking process will be implemented to ensure plans, schedules, risks and contingencies for VDL project activities and deliverables are complete, continually updated, and regularly reviewed with service providers. These will be reported on using Departmental Project Management Framework tools such as the monthly Dashboard, and monthly Interdependency Report to ensure clear timeframes are articulated across the agency.
In collaboration with service partners, the VDL project will continue to report to committees (such as the Strategic Management Committee [SMC]) in order that interdependencies, risks, contingencies and issues be shared and addressed with other parts of the agency.
Deliverables and timelines
The Assistant Chief Statistician, Strategic Engagement (Field 4), will ensure the delivery of:
- An enhanced tracking process for plans, schedules, risks and contingencies. (July 2021 – Director General [DG] Data Access and Dissemination Branch)
Recommendation 2
The Assistant Chief Statistician, Strategic Engagement (Field 4), should ensure that governance mechanisms are in place that effectively manage horizontal activities in a holistic manner including the clear establishment and understanding of roles and responsibilities.
Management response
Management agrees with the recommendation.
The existing governance structure and processes for the VDL for the regular reporting of progress, planning of upcoming activities, reviewing of roles and responsibilities, and evaluating of risks will be formalized to ensure they are complete and conducted in a holistic horizontal manner; the updated structure will be presented to a senior level committee such as SMC. The VDL project will regularly report progress through governance and oversight mechanisms to ensure issues are addressed consistently, effectively, and holistically.
The VDL project will continue to participate in a number of multi-divisional working groups and committees where horizontal activities can be discussed. In collaboration with service partners, a complete review of roles and responsibilities for all remaining key activities will be undertaken. Findings will be reported to senior management committees such as the SMC, where changes can be approved. The effectiveness of the redefined roles and responsibilities will be evaluated through the pilots and Service Level Agreements based on the results will be prepared before the launch of the VDL in production.
Deliverables and timelines
The Assistant Chief Statistician, Strategic Engagement (Field 4), will ensure the delivery of:
- A formalized governance structure and processes for the VDL process. (June 2021 - DG Data Access and Dissemination Branch)
- A completed review of roles and responsibilities for the VDL project. (July 2021 - DG Data Access and Dissemination Branch)
- Completed Service Level Agreements. (October 2021 - DG Data Access and Dissemination Branch)
Appendix A
Description for Evaluation types
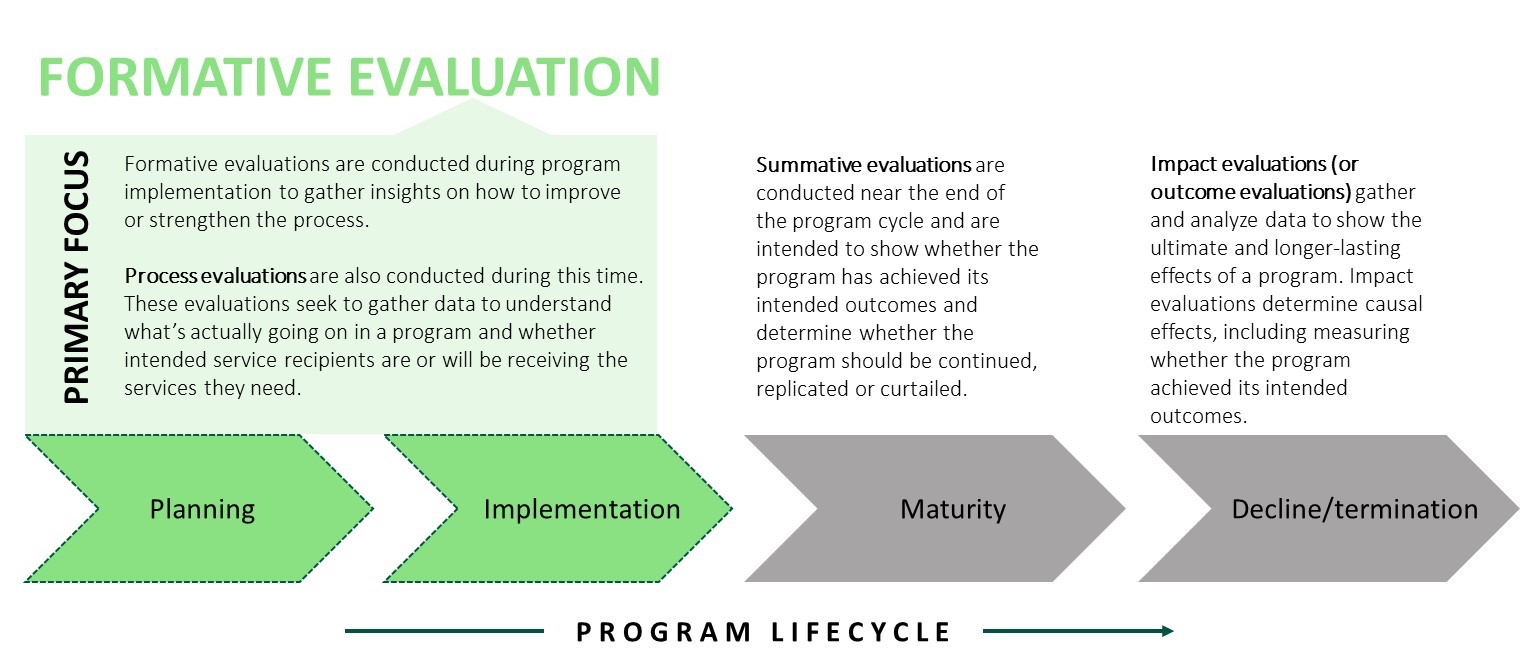
The figure depicts three types of evaluations mapped against a program lifecycle which includes four stages (planning, implementation, maturity, and decline/termination).
Formative evaluations are conducted during program implementation to gather insights on how to improve or strengthen the process. Process evaluations are also conducted during this time. These evaluations seek to gather data to understand what's actually going on in a program and whether the intended service recipients are or will be receiving the services they need.
Summative evaluations are conducted near the end of the program cycle and are intended to show whether the program has achieved its intended outcomes and determine whether the program should be continued, replicated or curtailed.
Impact evaluations (or outcome evaluations) gather and analyze data to show the ultimate and longer-lasting effects of a program. Impact evaluations determine causal effects, including measuring whether the program achieved its intended outcomes.
Appendix B – Virtual Data Lab business case
The historical background for this project
In 2017, Statistics Canada developed a modernization vision, which included an expansion of access to social and business microdata and administrative data. The approved direction is to develop new ways of accessing microdata (e.g., through virtual access), modernize existing tools that support access to microdata and make more types of data available to the user.
In modernizing our access to microdata, this project plans to
- enhance UX when accessing anonymized microdata
- leverage new technology, methods and data
- apply risk management practices (to optimize data accessibility with protective measures)
- increase collaboration and partnerships between data users and providers
- build analytical and research capacity
- support stronger evidence-based decision-making.
The overall business context into which the project fits
Research communities have expressed the need to better access Statistics Canada data holdings. As we improve data access, we are
- enhancing users' experience when working with anonymized microdata
- harnessing new technologies
- changing the culture in terms of our risk measures, reducing barriers and reconsidering how we can share risk with our partners
- increasing our collaborative efforts and increasing our analytical and research capacities
- providing more types of data and more integrated datasets to researchers and policy makers, and allowing for stronger evidence-based decision making and policy making.
In increasing data access, our objectives are to
- facilitate its use for leading-edge research and analysis across the country
- drive innovation and inclusion
- support evidence-based decision-making and policy-making
- better enable the mobilization of data across the federal government using Statistics Canada's expertise and capacity.
The drivers that triggered the change
Because of advances in technology, the current access programs no longer meet the needs of researchers. Existing tools are becoming outdated and need to be modernized. Our metadata systems also need to be strengthened and modernized.
Appendix C – Business outcome indicators and performance measurement method
| Business outcome title | Indicator | Baseline | Target | Timeframe to achieve outcomes | Performance measurement method | Responsible |
|---|---|---|---|---|---|---|
| Growth in the number of researchers using Canadian data and microdata files | Number of researchers and public servants accessing microdata virtually | 1,000/year in research data centres and Federal Research Data Centres (FRDCs); 100 at the Canadian Centre for Data Development and Economic Research. | Gradual increase to meet demand | 31/03/2021 | Tracking methods, vetting reports, notification emails, feedback | Data Access Division (DAD) |
| New microdata sets made available to researchers | Data holdings increase | Increase business data into RDCs and FRDCs | 2021 | DAD | ||
| New and increased data partnerships with other government departments | Data holdings increase | Increase number of holdings by 100% | 31/03/2021 | DAD | ||
| Faster and more timely onboarding of researchers to the Virtual Data Lab (VDL) | Number of processing days | One week | Six months after creation of VDL | Tracking methods | DAD | |
| Increased performance of system surrounding data retrieval and export | Processing time, user feedback on system performance | Variable based on scope of research project by researchers | March 2021 | Tracking methods, feedback | DAD | |
| Increased data accessibility | Number of data files made available for access | March 2021 | DAD | |||
| Increased client satisfaction | Percentage increase in user satisfaction measured through client survey | March 2021 | DAD |
Appendix D – Statistics Canada's modernization initiative
The Vision: A Data-driven Society and Economy
Modernizing Statistics Canada's workplace culture and its approach to collecting and producing statistics will result in greater and faster access to needed statistical products for Canadians. Specifically, the initiative and its projects will:
- Ensure more timely and responsive statistics – Ensuring Canadians have the data they need when they need it!
- Provide leadership in stewardship of the Government of Canada's data asset: Improve and increase alignment and collaboration with counterparts at all levels of government as well as private sector and regulatory bodies to create a whole of government, integrated approach to collection, sharing, analysis and use of data
- Raise the awareness of Statistics Canada's data and provide seamless access
- Develop and release more granular statistics to ensure Canadians have the detailed information they need to make the best possible decisions.
The Pillars
User-Centric Delivery Service:
- Users have the information/data they need, when they need it, in the way they want to access it, with the tools and knowledge to make full use of it.
- User-centric focus is embedded in Statistics Canada's culture.
Leading-edge Methods and Data Integration:
- Access to new or untapped data modify the role of surveys.
- Greater reliance on modelling and integration capacity through R&D environment.
Statistical Capacity Building and Leadership:
- Whole of government, integrated approach to collection, sharing, analysis and use of data.
- Statistics Canada is the leader identifying, building and fostering savvy information and critical analysis skills beyond our own perimeters.
Sharing and Collaboration:
- Program and services are delivered taking a coordinated approach with partners and stakeholders.
- Partnerships allow for open sharing of data, expertise and best practices.
- Barriers to accessing data are removed.
Modern Workforce and Flexible Workplace:
- Organization is agile, flexible and responsive to client needs.
- Have the talent and environment required to fulfill our current business needs and be open and nimble to continue to position ourselves for the future.
Expected Outcome
Modern and Flexible Operations: Reduced costs to industry, streamlined internal processes and improved efficiency/support of existing and new activities.
Appendix E – Contingency plans
- Proposal process: Data Analytics as a Service's "how might we" statements (developed in collaboration with the Virtual Data Lab [VDL] team) and research data centre (RDC) experts noted this as a challenge that should be overcome for VDL users. This sentiment was echoed by the business outcome indicators of the VDL project plan, according to which the project should facilitate faster and timelier onboarding of researchers to the VDL (a goal of one week of onboarding within the first six months of the VDL).
- Although the proposal process itself was identified as a challenge, the discoverability of data and variables included in the files for which researchers are seeking access was also noted as an obstacle to developing a proposal. Although this challenge has been partly resolved through collaboration with subject-matter areas (including variables in the Integrated Metadatabase), contingency plans for providing this service were not identified. Data discoverability improvements are contingent on the acquisition of a new Client Relationship Management System that includes these capabilities, for which there was no clear timeline. No secondary strategy was identified.
- Many administrative challenges related to the proposal process are intended to be overcome through the implementation of the Microdata Access Portal. However, no contingency plan was identified in the event of delivery being delayed or specifications being changed.
- The project plan outlines an intended onboarding process of one week per user, although monitoring of progress toward this and other business indicators was not identified. It would be beneficial to begin monitoring indicators laid out in the project plan as a means to reprioritize and provide clarity on project timelines and intended outcomes.
- Vetting process: The VDL business case suggested that the VDL will "grant researchers and administrative personnel access to a variety of modern tools such as analytical software, visualization and client relations management tools that will have the appropriate monitoring controls and vetting procedures built-in." Much like the proposal process, users expressed challenges with the existing vetting process. This feedback was consistent across the Canadian Research Data Centres Network, but was also included in initial feedback received from Canada Mortgage and Housing Corporation researchers on the VDL pilot.
- Addressing the current vetting process was not identified as a short-term priority. It was noted that the process could be enhanced by implementing automated or built-in vetting tools (e.g., the Output Checker Workflow Application, which was being analyzed at the time of the evaluation). In the shorter term, the VDL team could work with other areas of the Data Access Division to implement a standard operating procedure to ensure that—at a bare minimum—the consistency and clarity of vetting training would be improved.