
Statement outlining results, risks and significant changes in operations, personnel and program
A) Introduction
Statistics Canada's mandate
Statistics Canada is a member of the Innovation, Science and Economic Development portfolio.
Statistics Canada’s role is to ensure that Canadians have access to a trusted source of statistics on Canada that meets their highest priority needs.
The Agency’s mandate derives primarily from the Statistics Act. The Act requires that the Agency collects, compiles, analyzes and publishes statistical information on the economic, social, and general conditions of the country and its people. It also requires that Statistics Canada conduct the census of population and the census of agriculture every fifth year, and protects the confidentiality of the information with which it is entrusted.
Statistics Canada also has a mandate to co-ordinate and lead the national statistical system. The Agency is considered a leader, among statistical agencies around the world, in co‑ordinating statistical activities to reduce duplication and reporting burden.
More information on Statistics Canada’s mandate, roles, responsibilities and programs can be found in the 2015–2016 Main Estimates and in the Statistics Canada 2015–2016 Report on Plans and Priorities.
The quarterly financial report
- should be read in conjunction with the 2015–2016 Main Estimates, the 2015-2016 Supplementary Estimates , the Quarterly Financial Report for the quarter ended June 30, 2015 and the Quarterly Financial Report for the quarter ended September 30, 2015;
- has been prepared by management, as required by Section 65.1 of the Financial Administration Act, and in the form and manner prescribed by Treasury Board;
- has not been subject to an external audit or review.
Statistics Canada has the authority to collect and spend revenue from other government departments and agencies, as well as from external clients, for statistical services and products.
Basis of presentation
This quarterly report has been prepared by management using an expenditure basis of accounting. The accompanying Statement of Authorities includes the Agency’s spending authorities granted by Parliament and those used by the Agency consistent with the Main Estimates for the 2015–2016 fiscal year. This quarterly report has been prepared using a special purpose financial reporting framework designed to meet financial information needs with respect to the use of spending authorities.
The authority of Parliament is required before moneys can be spent by the Government. Approvals are given in the form of annually approved limits through appropriation acts or through legislation in the form of statutory spending authority for specific purposes.
The Agency uses the full accrual method of accounting to prepare and present its annual departmental financial statements that are part of the departmental performance reporting process. However, the spending authorities voted by Parliament remain on an expenditure basis.
B) Highlights of fiscal quarter and fiscal year-to-date results
This section highlights the significant items that contributed to the net increase in resources available for the year, as well as actual expenditures for the quarter ended December 31.
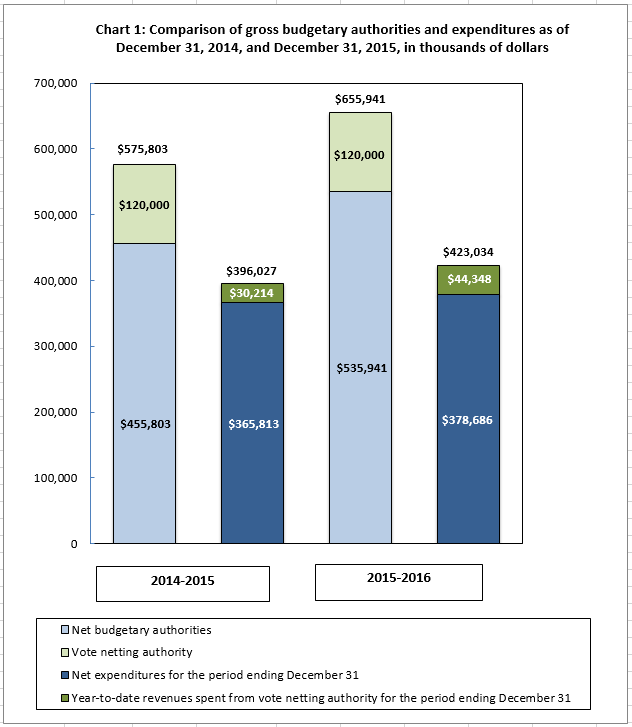
Description for Chart 1: Comparison of gross budgetary authorities and expenditures as of December 31, 2014, and December 31, 2015, in thousands of dollars
This bar graph shows Statistics Canada's budgetary authorities and expenditures, in thousands of dollars, as of December 31, 2014 and 2015:
- As at December 31, 2014
- Net budgetary authorities: $455,803
- Vote netting authority: $120,000
- Total authority: $575,803
- Net expenditures for the period ending December 31: $365,813
- Year-to-date revenues spent from vote netting authority for the period ending December 31: $30,214
- Total expenditures: $396,027
- As at December 31, 2015
- Net budgetary authorities: $535,941
- Vote netting authority: $120,000
- Total authority: $655,941
- Net expenditures for the period ending December 31: $378,686
- Year-to-date revenues spent from vote netting authority for the period ending December 31: $44,348
- Total expenditures: $423,034
Chart 1 outlines the gross budgetary authorities, which represent the resources available for use for the year as of December 31.
Significant changes to authorities
During the third quarter, Statistics Canada authorities increased by $4.5 million compared with the second quarter of 2015-2016. The increase is related to funding received for the arbitral decision awarded to Statistical Survey Operations’ interviewers workforce.
Total authorities available for 2015–2016 have increased by $80.1 million, or 14%, from the previous year, from $575.8 million to $655.9 million (Chart 1). This net increase was mostly the result of the following:
- increase for the Census of Population Program ($92 million), as well as for the Census of Agriculture ($7.2 million)
- increase in funding received for collective agreements mainly for the interviewers ($4.6 million)
This increase is offset by the following:
- decrease in the value of the carry-forward ($16.5 million)
- no reimbursement requested from Treasury Board Secretariat for specific salary expenditures in 2015-16 ($5.7 million)
In addition to the appropriations allocated to the Agency through the Main Estimates, Statistics Canada also has vote net authority within Vote 105, which entitles the Agency to spend revenues collected from other government departments, agencies, and external clients to provide statistical services. Vote netting authority is stable at $120 million in each of the fiscal years 2014–2015 and 2015–2016.
Significant changes to expenditures
Year-to-date net expenditures recorded to the end of the third quarter increased by $12.9 million, or 3.5% from the previous year, from $365.8 million to $378.7 million. (See Table A: Variation in Departmental Expenditures by Standard Object.)
Statistics Canada spent approximately 71% of its authorities by the end of the third quarter, compared with 80% in the same quarter of 2014–2015.
| Departmental Expenditures Variation by Standard Object | Q3 year-to-date variation between fiscal year 2014-2015 and 2015-2016 | |
|---|---|---|
| $'000 | % | |
| Note: Explanations are provided for variances of more than $1 million. | ||
| (01) Personnel | 31,104 | 9.0 |
| (02) Transportation and communications | 2,040 | 23.8 |
| (03) Information | 4,163 | 450.0 |
| (04) Professional and special services | (3,693) | (23.5) |
| (05) Rentals | 4,541 | 61.3 |
| (06) Repair and maintenance | (311) | (28.9) |
| (07) Utilities, materials and supplies | 48 | 3.4 |
| (08) Acquisition of land, buildings and works | 0 | 0 |
| (09) Acquisition of machinery and equipment | 2,671 | 416.7 |
| (10) Transfer payments | 0 | 0 |
| (12) Other subsidies and payments | (13,556) | (98.8) |
| Total gross budgetary expenditures | 27,007 | 6.8 |
| Less revenues netted against expenditures | ||
| Revenues | 14,134 | 46.8 |
| Total net budgetary expenditures | 12,873 | 3.5 |
Description for Table A: Departmental expenditures by Standard Object (unaudited) This table displays the variance of departmental expenditures by standard object between fiscal 2014-2015 and 2015-2016. The variance is calculated for year to date expenditures as at the end of the third quarter. The row headers provide information by standard object. The column headers provide information in thousands of dollars and percentage variance for the year to date variation.
01) Personnel: The increase was mainly the result of the arbitration award including the severance liquidation payment for interviewers and increased salary expenditures due to the cyclical nature of the Census.
02) Transportation and Communications: The increase was the result of timing differences between years for the postage purchase and travel for cost recovery projects as well as an increase in collection activities due to the cyclical nature of some surveys.
03) Information: The increase was the result of printing expenses for the Census as well as the coding review of the standard object definitions and inclusions (e.g., data purchases).
04) Professional and special services: The decrease was the result of the coding review of the standard object definitions and inclusions (e.g., data purchases) and a reduction in spending on informatics services.
05) Rentals: The increase was the result of the cyclical nature of the Census (e.g., rental of building space) and additional software licenses fees related to new infrastructure and due to changes in contract payment schedules.
09) Acquisition of machinery and equipment: The increase was the result of timing differences between years for the acquisition of computer equipment, as well as additional acquisitions for the Census. Also, there was an increase in the purchase of office equipment attributable to our space optimization plan.
12) Other subsidies and payments: The decrease is a result of the one-time transition payment for implementing salary payment in arrears made in the first quarter of 2014–2015 by the Government of Canada.
Revenues: The increase is primarily the result of timing differences in the receipt of funds for scheduled key deliverables and a new significant cost recovery survey contract.
C) Risks and uncertainties
In 2015–2016, Statistics Canada plans to continue to monitor financial pressures due to the continuation of the federal operating budget freeze with the following actions and mitigation strategies:
- additional analysis, monitoring and validation of financial and human resources information through a monthly financial review by budget holders;
- review of monthly project dashboards in place across the Agency to monitor project issues, risks and alignment with approved budgets;
- continued realignment and reprioritization of work.
In addition, while Statistics Canada continues to work collaboratively with its service providers to ensure affordable and timely delivery of its key statistical programs, the Agency has experienced issues and challenges with its information technology services during the third quarter.
Statistics Canada uses risk management and a risk-based decision-making process to prioritize and conduct its business. In order to effectively do so the Agency identifies its key risks and develops corresponding mitigation strategies in its Corporate Risk Profile.
D) Significant changes to operations, personnel and programs
There have been significant changes to operations, personnel and programs over the last quarter due to the hiring of close to 600 employees for regional operations related to the 2016 Census of Population Program. The increase in activities related to this program will perpetuate over the coming quarters.
Approval by senior officials
The original version was signed by
Wayne R. Smith, Chief Statistician
Stéphane Dufour, Chief Financial Officer
Date signed February 22, 2016
| Fiscal year 2015-2016 | |||
|---|---|---|---|
| Planned expenditures for the year ending March 31, 2016 | Expended during the quarter ended December 31, 2015 | Year-to-date used at quarter-end | |
| in thousands of dollars | |||
| Expenditures | |||
| (01) Personnel | 484,748 | 131,624 | 377,643 |
| (02) Transportation and communications | 38,602 | 4,354 | 10,607 |
| (03) Information | 17,340 | 2,876 | 5,088 |
| (04) Professional and special services | 56,557 | 5,163 | 12,053 |
| (05) Rentals | 25,410 | 1,042 | 11,955 |
| (06) Repair and maintenance | 7,559 | 289 | 766 |
| (07) Utilities, materials and supplies | 11,104 | 735 | 1,450 |
| (08) Acquisition of land, buildings and works | 0 | 0 | 0 |
| (09) Acquisition of machinery and equipment | 14,437 | 827 | 3,312 |
| (10) Transfer payments | 100 | 0 | 0 |
| (12) Other subsidies and payments | 84 | 20 | 160 |
| Total gross budgetary expenditures | 655,941 | 146,930 | 423,034 |
| Less revenues netted against expenditures | |||
| Revenues | 120,000 | 24,651 | 44,348 |
| Total revenues netted against expenditures | 120,000 | 24,651 | 44,348 |
| Total net budgetary expenditures | 535,941 | 122,279 | 378,686 |
| Fiscal year 2014-2015 | |||
|---|---|---|---|
| Planned expenditures for the year ending March 31, 2015 | Expended during the quarter ended December 31, 2014 | Year-to-date used at quarter-end | |
| in thousands of dollars | |||
| Expenditures | |||
| (01) Personnel | 446,827 | 118,124 | 346,539 |
| (02) Transportation and communications | 33,810 | 3,514 | 8,567 |
| (03) Information | 3,286 | 519 | 925 |
| (04) Professional and special services | 46,744 | 7,503 | 15,746 |
| (05) Rentals | 17,233 | 979 | 7,414 |
| (06) Repair and maintenance | 9,228 | 413 | 1,077 |
| (07) Utilities, materials and supplies | 17,368 | 558 | 1,402 |
| (08) Acquisition of land, buildings and works | 0 | 0 | 0 |
| (09) Acquisition of machinery and equipment | 1,080 | 173 | 641 |
| (10) Transfer payments | 0 | 0 | 0 |
| (12) Other subsidies and payments | 227 | 122 | 13,716 |
| Total gross budgetary expenditures | 575,803 | 131,905 | 396,027 |
| Less revenues netted against expenditures | |||
| Revenues | 120,000 | 11,553 | 30,214 |
| Total revenues netted against expenditures | 120,000 | 11,553 | 30,214 |
| Total net budgetary expenditures | 455,803 | 120,352 | 365,813 |
Description for Appendix A: Departmental expenditures by Standard Object (unaudited) Table 1:
This table displays the departmental expenditures by standard object for the fiscal year 2015-2016. The row headers provide information by standard object for expenditures and revenues. The column headers provide information in thousands of dollars for planned expenditures for the year ending March 31; expended during the quarter ended December 31; and year to date used at quarter-end 2015-2016.
Table 2:
This table displays the departmental expenditures by standard object for the fiscal year 2014-2015. The row headers provide information by standard object for expenditures and revenues. The column headers provide information in thousands of dollars for planned expenditures for the year ending March 31; expended during the quarter ended December 31; and year to date used at quarter-end 2014-2015.
| Fiscal year 2015-2016 | |||
|---|---|---|---|
| Total available for use for the year ending March 31, 2016* | Used during the quarter ended December 31, 2015 | Year to date used at quarter-end | |
| in thousands of dollars | |||
| * Includes only authorities available for use and granted by Parliament at quarter-end. | |||
| Vote 105 — Net operating expenditures | 466,863 | 105,009 | 326,877 |
| Statutory authority — Contribution to employee benefit plans | 69,078 | 17,270 | 51,809 |
| Total budgetary authorities | 535,941 | 122,279 | 378,686 |
| Fiscal year 2014-2015 | |||
|---|---|---|---|
| Total available for use for the year ended March 31, 2015* | Used during the quarter ended December 31, 2014 | Year to date used at quarter-end | |
| in thousands of dollars | |||
| * Includes only authorities available for use and granted by Parliament at quarter-end. | |||
| Vote 105 — Net operating expenditures | 392,421 | 106,149 | 323,204 |
| Statutory authority — Contribution to employee benefit plans | 63,382 | 14,203 | 42,609 |
| Total budgetary authorities | 455,803 | 120,352 | 365,813 |
Description for Appendix B: Statement of authorities (unaudited)
Table 1:
This table displays the departmental authorities for the fiscal year 2015-2016. The row headers provide information by type of authority, Vote 105 – Net operating expenditures, Statutory authority and Total Budgetary authorities. The column headers provide information in thousands of dollars for Total available for use for the year ending March 31; used during the quarter ended December 31; and year to date used at quarter-end for 2015-2016.
Table 2:
This table displays the departmental authorities for the fiscal year 2014-2015. The row headers provide information by type of authority, Vote 105 – Net operating expenditures, Statutory authority and Total Budgetary authorities. The column headers provide information in thousands of dollars for Total available for use for the year ending March 31; used during the quarter ended December 31; and year to date used at quarter-end for 2014-2015.