
Statement outlining results, risks and significant changes in operations, personnel and program
A) Introduction
Statistics Canada's mandate
Statistics Canada ("the agency") is a member of the Innovation, Science and Industry portfolio.
Statistics Canada's role is to ensure that Canadians have access to a trusted source of statistics on Canada that meets their highest priority needs.
The agency's mandate derives primarily from the Statistics Act. The Act requires that the agency collects, compiles, analyzes and publishes statistical information on the economic, social, and general conditions of the country and its people. It also requires that Statistics Canada conduct the census of population and the census of agriculture every fifth year, and protects the confidentiality of the information with which it is entrusted.
Statistics Canada also has a mandate to co-ordinate and lead the national statistical system. The agency is considered a leader, among statistical agencies around the world, in co–ordinating statistical activities to reduce duplication and reporting burden.
More information on Statistics Canada's mandate, roles, responsibilities and programs can be found in the 2020–2021 Main Estimates and in the Statistics Canada 2020–2021 Departmental Plan.
The Quarterly Financial Report:
- should be read in conjunction with the 2020–2021 Main Estimates;
- has been prepared by management, as required by Section 65.1 of the Financial Administration Act, and in the form and manner prescribed by Treasury Board of Canada Secretariat;
- has not been subject to an external audit or review.
Statistics Canada has the authority to collect and spend revenue from other federal government departments and agencies, as well as from external clients, for statistical services and products.
Basis of presentation
This quarterly report has been prepared by management using an expenditure basis of accounting. The accompanying Statement of Authorities includes the agency’s spending authorities granted by Parliament and those used by the agency consistent with the Main Estimates for the 2020–2021 fiscal year. Due to the COVID-19 pandemic (the pandemic) and limited sessions in the spring for Parliament to study supply, the Standing Orders of the House of Commons were amended to extend the study period into the fall. The agency received the remainder of the full supply for the 2020-21 Main Estimates as of December 2020. This quarterly report has been prepared using a special purpose financial reporting framework designed to meet financial information needs with respect to the use of spending authorities.
The authority of Parliament is required before moneys can be spent by the Government. Approvals are given in the form of annually approved limits through appropriation acts or through legislation in the form of statutory spending authority for specific purposes.
The agency uses the full accrual method of accounting to prepare and present its annual departmental financial statements that are part of the departmental results reporting process. However, the spending authorities voted by Parliament remain on an expenditure basis.
B) Highlights of fiscal quarter and fiscal year-to-date results
This section highlights the significant items that contributed to the net increase in resources available for the year, as well as actual expenditures for the quarter ended December 31.
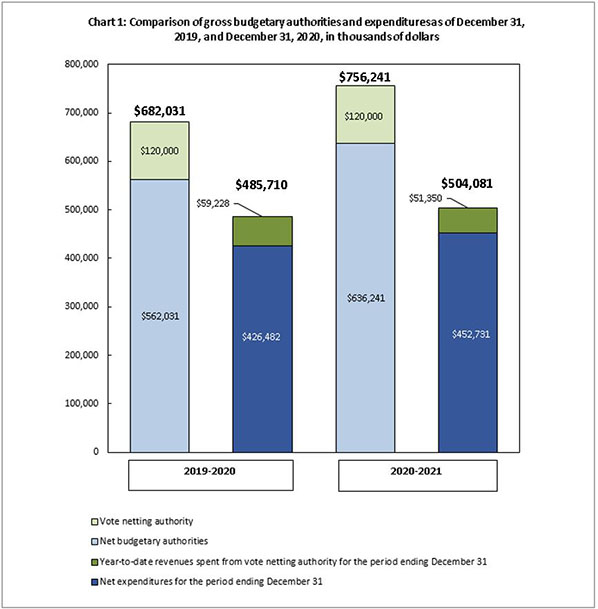
Description for Chart 1: Comparison of gross budgetary authorities and expenditures as of December 31, 2019, and December 31, 2020, in thousands of dollars
This bar graph shows Statistics Canada's budgetary authorities and expenditures, in thousands of dollars, as of December 31, 2019 and 2020:
- As at December 31, 2019
- Net budgetary authorities: $562,031
- Vote netting authority: $120,000
- Total authority: $682,031
- Net expenditures for the period ending December 31: $426,482
- Year-to-date revenues spent from vote netting authority for the period ending December 31: $59,228
- Total expenditures: $485,710
- As at December 31, 2020
- Net budgetary authorities: $636,241
- Vote netting authority: $120,000
- Total authority: $756,241
- Net expenditures for the period ending December 31: $452,731
- Year-to-date revenues spent from vote netting authority for the period ending December 31: $51,350
- Total expenditures: $504,081
Chart 1 outlines the gross budgetary authorities, which represent the resources available for use for the year as of December 31.
Significant changes to authorities
Total authorities available for 2020–2021 have increased by $74.2 million, or 10.9%, from the previous year, from $682.0 million to $756.2 million (Chart 1). The Agency has received the full supply as of December 2020. The net increase is mostly the result of the following:
- An increase of $80.5 million for the 2021 Census of Population program for new cyclical funding received to cover planning and developmental activities;
- An increase of $2.5 million for the ratification of collective agreements;
- A decrease of $3.5 million for the Statistical Survey Operations pay equity settlement, marking the near completion of the settlement;
- A decrease of $2.1 million for the Survey of Financial Security and Annual Household wealth.
The variance is also explained by the reception of authorities at different quarters throughout the year.
In addition to the appropriations allocated to the agency through the Main Estimates, Statistics Canada also has vote net authority within Vote 1, which entitles the agency to spend revenues collected from other federal government departments, agencies, and external clients to provide statistical services. The vote netting authority is stable at $120 million when comparing the third quarter of fiscal years 2019–2020 and 2020-2021.
Significant changes to expenditures
Year-to-date net expenditures recorded to the end of the third quarter increased by $26.2 million, or 6.2% from the previous year, from $426.5 million to $452.7 million (see Table A: Variation in Departmental Expenditures by Standard Object).
Statistics Canada spent approximately 71.2% of its authorities by the end of the third quarter, compared with 75.9% in the same quarter of 2019–2020.
| Departmental Expenditures Variation by Standard Object: | Q3 year-to-date variation between fiscal year 2019–2020 and 2020–2021 | |
|---|---|---|
| $'000 | % | |
| (01) Personnel | 23,525 | 5.5 |
| (02) Transportation and communications | -8,318 | -73.3 |
| (03) Information | 163 | 3.2 |
| (04) Professional and special services | -2,295 | -11.9 |
| (05) Rentals | 4,404 | 28.4 |
| (06) Repair and maintenance | -254 | -46.6 |
| (07) Utilities, materials and supplies | 337 | 54.7 |
| (08) Acquisition of land, buildings and works | 199 | 286.7 |
| (09) Acquisition of machinery and equipment | 415 | 12.7 |
| (10) Transfer payments | - | N/A |
| (12) Other subsidies and payments | 195 | 70.6 |
| Total gross budgetary expenditures | 18,371 | 3.8 |
| Less revenues netted against expenditures: | ||
| Revenues | -7,878 | -13.3 |
| Total net budgetary expenditures | 26,249 | 6.2 |
| Note: Explanations are provided for variances of more than $1 million. | ||
Personnel: There is an overall increase in the agency’s activities as the 2021 Census ramps up for its main operational period in the first quarter of 2021-22. The increase is also attributable to additional workload required for initiatives related to the cloud.
Transportation and communications: The decrease is mainly due to postage costs of the 2019 Census Test that occurred last fiscal year, as well as travel being significantly reduced this fiscal year due to the pandemic.
Professional and special services: The decrease is mainly due to some surveys being delayed to the next fiscal year and reduction in certain training costs. This is slightly offset by an increase mainly in information technology consultant services.
Rentals: The increase is mainly due to the cost of software licence maintenance being higher than last fiscal year, and to additional costs for logistical requirements for the 2021 Census.
Revenues: The decrease is due to the shift of key deliverables to the last quarter as a result of the pandemic. While certain contracts were cancelled or not renewed, new contracts are being negotiated to be delivered this fiscal year.
C) Risks and uncertainties
Statistics Canada is currently expending significant effort in modernizing its business processes and tools, in order to maintain its relevance and maximize the value it provides to Canadians. As a foundation piece for some of these efforts, the agency is working in collaboration with Shared Services Canada and Treasury Board of Canada Secretariat, Office of the Chief Information Officer, to ensure the agency has access to adequate information technology services and support to attain its modernization objectives and successfully transition its infrastructure and applications to the cloud. Activities and related costs are projected based on various assumptions that can change, depending on the nature and degree of work required to accomplish the initiatives.
Statistics Canada is facing fiscal pressures due to the sudden impact of the global pandemic. The agency faced significant reductions in its cost recovery activities in the first half of the year as well as increased operational costs associated with the delivery of the 2021 Census Program under a pandemic environment. Risks and uncertainties are being mitigated by the agency's proactive planning assumptions review, mitigation strategies and engagement with central agencies and partners.
D) Significant changes to operations, personnel and programs
The agency is planning changes in operations and program activities with financial implications including:
- The Census program is ramping up for the 2021 Census which is in the advanced planning stage. As such, expenditures for this program are increasing. The program is also facing some unanticipated financial pressures, as it needed to adapt its procedures to account for the pandemic and ensure field operations are conducted in the safest way possible in 2021. This resulted in additional expenditures. Economic increases have also materialized higher than planned, adding additional pressures to the program;
- New efforts and collaboration to provide data and insights related to the impact of the pandemic on the society and economy;
- Although the Agency suffered financial loss associated with reductions in its cost recovery activities in the early months of the pandemic, revenue beginning in this quarter have now stabilized back to more normal levels. The new cost recovery work comes with equivalent cost and does not offset the financial loss from earlier in the year.
Approval by senior officials
Approved by:
Anil Arora, Chief Statistician
Monia Lahaie, Chief Financial Officer
Ottawa, Ontario
Signed on: February 19, 2021
Appendix
| Fiscal year 2020–2021 | Fiscal year 2019–2020 | |||||
|---|---|---|---|---|---|---|
| Total available for use for the year ending March 31, 2021Tablenote 1 | Used during the quarter ended December 31, 2020 | Year-to-date used at quarter-end | Total available for use for the year ending March 31, 2020Tablenote 1 | Used during the quarter ended December 31, 2019 | Year-to-date used at quarter-end | |
| in thousands of dollars | ||||||
| Vote 1 — Net operating expenditures | 560,162 | 113,147 | 395,671 | 489,280 | 127,985 | 372,887 |
| Statutory authority — Contribution to employee benefit plans | 76,079 | 19,020 | 57,060 | 72,751 | 17,865 | 53,595 |
| Total budgetary authorities | 636,241 | 132,167 | 452,731 | 562,031 | 145,850 | 426,482 |
|
||||||
| Fiscal year 2020–2021 | Fiscal year 2019–2020 | |||||
|---|---|---|---|---|---|---|
| Planned expenditures for the year ending March 31, 2021 | Expended during the quarter ended December 31, 2020 | Year-to-date used at quarter-end | Planned expenditures for the year ending March 31, 2020 | Expended during the quarter ended December 31, 2019 | Year-to-date used at quarter-end | |
| in thousands of dollars | ||||||
| Expenditures: | ||||||
| (01) Personnel | 601,596 | 159,160 | 453,286 | 574,658 | 154,217 | 429,761 |
| (02) Transportation and communications | 24,811 | 1,465 | 3,029 | 18,881 | 4,450 | 11,347 |
| (03) Information | 27,521 | 1,955 | 5,251 | 9,161 | 1,070 | 5,088 |
| (04) Professional and special services | 62,999 | 4,934 | 16,956 | 43,048 | 6,205 | 19,251 |
| (05) Rentals | 14,755 | 2,095 | 19,885 | 12,998 | 4,248 | 15,481 |
| (06) Repair and maintenance | 973 | -385 | 291 | 678 | 306 | 545 |
| (07) Utilities, materials and supplies | 2,341 | 709 | 954 | 4,072 | 321 | 617 |
| (08) Acquisition of land, buildings and works | 741 | 176 | 269 | 625 | 67 | 70 |
| (09) Acquisition of machinery and equipment | 20,359 | 760 | 3,689 | 14,085 | 2,118 | 3,274 |
| (10) Transfer payments | 100 | - | - | 100 | - | - |
| (12) Other subsidies and payments | 45 | -79 | 471 | 3,725 | -3 | 276 |
| Total gross budgetary expenditures | 756,241 | 170,790 | 504,081 | 682,031 | 172,999 | 485,710 |
| Less revenues netted against expenditures: | ||||||
| Revenues | 120,000 | 38,623 | 51,350 | 120,000 | 27,149 | 59,228 |
| Total revenues netted against expenditures | 120,000 | 38,623 | 51,350 | 120,000 | 27,149 | 59,228 |
| Total net budgetary expenditures | 636,241 | 132,167 | 452,731 | 562,031 | 145,850 | 426,482 |