
Statement outlining results, risks and significant changes in operations, personnel and program
A) Introduction
Statistics Canada's mandate
Statistics Canada ("the agency") is a member of the Innovation, Science and Industry portfolio.
Statistics Canada's role is to ensure that Canadians have access to a trusted source of statistics on Canada that meets their highest priority needs.
The agency's mandate derives primarily from the Statistics Act. The Act requires that the agency collects, compiles, analyzes and publishes statistical information on the economic, social, and general conditions of the country and its people. It also requires that Statistics Canada conduct the census of population and the census of agriculture every fifth year, and protects the confidentiality of the information with which it is entrusted.
Statistics Canada also has a mandate to co-ordinate and lead the national statistical system. The agency is considered a leader, among statistical agencies around the world, in co–ordinating statistical activities to reduce duplication and reporting burden.
More information on Statistics Canada's mandate, roles, responsibilities and programs can be found in the 2021–2022 Main Estimates and in the Statistics Canada 2021–2022 Departmental Plan.
The Quarterly Financial Report:
- should be read in conjunction with the 2021–2022 Main Estimates;
- has been prepared by management, as required by Section 65.1 of the Financial Administration Act, and in the form and manner prescribed by Treasury Board of Canada Secretariat;
- has not been subject to an external audit or review.
Statistics Canada has the authority to collect and spend revenue from other federal government departments and agencies, as well as from external clients, for statistical services and products.
Basis of presentation
This quarterly report has been prepared by management using an expenditure basis of accounting. The accompanying Statement of Authorities includes the agency's spending authorities granted by Parliament and those used by the agency consistent with the Main Estimates for the 2021–2022 fiscal year. This quarterly report has been prepared using a special purpose financial reporting framework designed to meet financial information needs with respect to the use of spending authorities.
The authority of Parliament is required before moneys can be spent by the Government. Approvals are given in the form of annually approved limits through appropriation acts or through legislation in the form of statutory spending authority for specific purposes.
The agency uses the full accrual method of accounting to prepare and present its annual departmental financial statements that are part of the departmental results reporting process. However, the spending authorities voted by Parliament remain on an expenditure basis.
B) Highlights of fiscal quarter and fiscal year-to-date results
This section highlights the significant items that contributed to the net increase in resources available for the year, as well as actual expenditures for the quarter ended December 31.
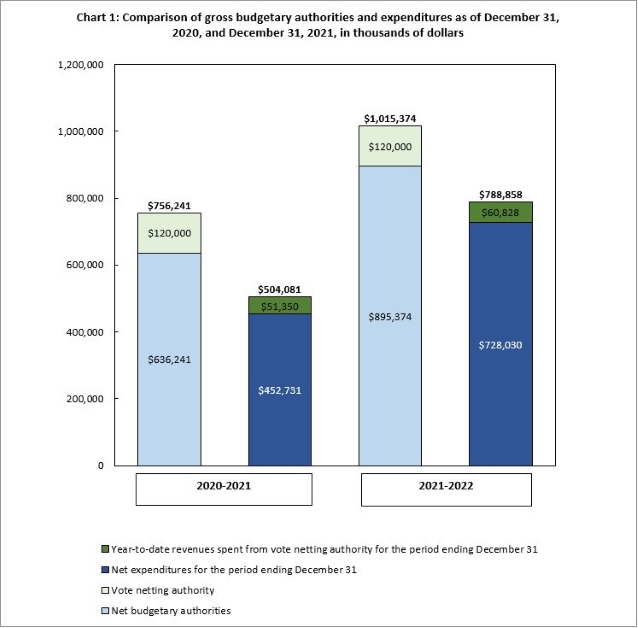
Description for Chart 1: Comparison of gross budgetary authorities and expenditures as of December 31, 2020, and December 31, 2021, in thousands of dollars
This bar graph shows Statistics Canada's budgetary authorities and expenditures, in thousands of dollars, as of December 31, 2020 and 2021:
- As at December 31, 2020
- Net budgetary authorities: $636,241
- Vote netting authority: $120,000
- Total authority: $756,241
- Net expenditures for the period ending December 31: $452,731
- Year-to-date revenues spent from vote netting authority for the period ending December 31: $51,350
- Total expenditures: $504,081
- As at December 31, 2021
- Net budgetary authorities: $895,374
- Vote netting authority: $120,000
- Total authority: $1,015,374
- Net expenditures for the period ending December 31: $728,030
- Year-to-date revenues spent from vote netting authority for the period ending December 31: $60,828
- Total expenditures: $788,858
Chart 1 outlines the gross budgetary authorities, which represent the resources available for use for the year as of December 31.
Significant changes to authorities
Total authorities available for 2021–2022 increased by $259.1 million, or 34.3%, from the previous year, from $756.2 million to $1,015.4 million (Chart 1). The net increase is mostly the result of the following:
- An increase of $222.5 million for the 2021 Census of Population and Census of Agriculture programs for new cyclical funding received to cover operational activities;
- An increase of $24.3 million for collective bargaining and other compensation adjustments negotiated by the unions;
- An increase of $15.7 million in response to financial pressures on cost-recovery activities during the pandemic;
- A decrease of $11.0 million for various initiatives including Workload Migration, Enabling Vision for Data-Drive Economy and Society and the New Anti-Racism Strategy.
In addition to the appropriations allocated to the agency through the Main Estimates, Statistics Canada also has vote net authority within Vote 1, which entitles the agency to spend revenues collected from other federal government departments, agencies, and external clients to provide statistical services. The vote netting authority is stable at $120 million when comparing the third quarter of fiscal years 2020–2021 and 2021-2022.
Significant changes to expenditures
Year-to-date net expenditures recorded to the end of the third quarter increased by $275.3 million, or 60.8% from the previous year, from $452.7 million to $728.0 million (see Table A: Variation in Departmental Expenditures by Standard Object).
Statistics Canada spent approximately 81.3% of its authorities by the end of the third quarter, compared with 71.2% in the same quarter of 2020–2021.
| Departmental Expenditures Variation by Standard Object: | Q3 year-to-date variation between fiscal year 2020–2021 and 2021–2022 | |
|---|---|---|
| $'000 | % | |
| (01) Personnel | 80,010 | 17.7 |
| (02) Transportation and communications | 55,742 | 1,840.3 |
| (03) Information | 16,733 | 318.7 |
| (04) Professional and special services | 129,591 | 764.3 |
| (05) Rentals | 598 | 3.0 |
| (06) Repair and maintenance | 774 | 266.0 |
| (07) Utilities, materials and supplies | -195 | -20.4 |
| (08) Acquisition of land, buildings and works | -247 | -91.8 |
| (09) Acquisition of machinery and equipment | 1,412 | 38.3 |
| (10) Transfer payments | - | N/A |
| (12) Other subsidies and payments | 359 | 76.2 |
| Total gross budgetary expenditures | 284,777 | 56.5 |
| Less revenues netted against expenditures: | ||
| Revenues | 9,478 | 18.5 |
| Total net budgetary expenditures | 275,299 | 60.8 |
| Note: Explanations are provided for variances of more than $1 million. | ||
Personnel: There is an overall increase in the agency’s activities due to the 2021 Census operations. The increase is also attributable to additional workload required for efforts related to supporting the response to the pandemic and the migration to the cloud. Furthermore, it reflects recently ratified collective agreements, as well as additional compensation secured in response to settlements negotiated for issues related to the Phoenix payroll system.
Transportation and communications: The increase is mainly due to postage costs for the mailing of Census questionnaires and related materials, as well as travel expenditures for enumerators for 2021 Census collection activity occurring this fiscal year.
Information: The increase is mainly due to advertisement cost for the 2021 Census operations and to printing costs for the 2021 Census materials such as questionnaires, envelopes, and letters.
Professional and special services: The increase is mainly due to the remuneration of Statistics Act employees hired to conduct the 2021 Census.
Acquisition of machinery and equipment: The increase is mainly due to the purchase of informatics equipment as per the Capital Plan.
Revenues: The increase is mainly due to the closing of regional offices and a delay in recording cost recovery activities related to Census during the beginning of the pandemic last fiscal year.
C) Risks and uncertainties
Statistics Canada is currently focusing effort on modernizing its business processes and tools, in order to maintain its relevance and maximize the value it provides to Canadians. As a foundation piece for some of these efforts, the agency is working in collaboration with Shared Services Canada and Treasury Board of Canada Secretariat, Office of the Chief Information Officer, to ensure the agency has access to adequate information technology services and support to attain its modernization objectives and successfully transition its infrastructure and applications to the cloud. Activities and related costs are projected based on various assumptions that can change, depending on the nature and degree of work required to accomplish the initiatives. Risks and uncertainties are being mitigated by the agency's strong financial planning management practices and integrated strategic planning framework.
D) Significant changes to operations, personnel and programs
The agency is managing changes in operations and program activities with financial implications including:
- The Census program is in its advanced implementation stage for the 2021 Census. As such, expenditures for this program increased as planned. Statistics Canada is undertaking major activities this fiscal year that are critical to the success of the 2021 Census of Population. These activities include hiring field staff, collecting data, follow-up with respondents, processing of returns, developing and testing dissemination systems and processes, and starting data quality and evaluation studies. These activities culminate in the first of the Census data releases, the Population and Dwelling Counts, in February 2022;
- Continued effort and collaboration to provide data and insights related to the impact of the pandemic on the society and economy;
- Budget 2021 announced funding for new initiatives including Disaggregated Data Action Plan, Justice Data Modernization, Quality of Life Framework for Canada, and the Health Care Access, Experiences and Related Outcomes Statistical Program, as well as Census of Environment.
Approval by senior officials
Approved by:
Anil Arora, Chief Statistician
Ziad Shadid, Acting Chief Financial Officer
Ottawa, Ontario
Signed on: February 18, 2022
Appendix
| Fiscal year 2021–2022 | Fiscal year 2020–2021 | |||||
|---|---|---|---|---|---|---|
| Total available for use for the year ending March 31, 2022Tablenote 1 | Used during the quarter ended December 31, 2021 | Year-to-date used at quarter-end | Total available for use for the year ending March 31, 2021Tablenote 1 | Used during the quarter ended December 31, 2020 | Year-to-date used at quarter-end | |
| in thousands of dollars | ||||||
| Vote 1 — Net operating expenditures | 808,940 | 146,904 | 667,199 | 560,162 | 113,147 | 395,671 |
| Statutory authority — Contribution to employee benefit plans | 86,434 | 20,277 | 60,831 | 76,079 | 19,020 | 57,060 |
| Total budgetary authorities | 895,374 | 167,181 | 728,030 | 636,241 | 132,167 | 452,731 |
|
||||||
| Fiscal year 2021–2022 | Fiscal year 2020–2021 | |||||
|---|---|---|---|---|---|---|
| Planned expenditures for the year ending March 31, 2022 | Expended during the quarter ended December 31, 2021 | Year-to-date used at quarter-end | Planned expenditures for the year ending March 31, 2021 | Expended during the quarter ended December 31, 2020 | Year-to-date used at quarter-end | |
| in thousands of dollars | ||||||
| Expenditures: | ||||||
| (01) Personnel | 678,110 | 169,408 | 533,296 | 601,596 | 159,160 | 453,286 |
| (02) Transportation and communications | 72,692 | 5,352 | 58,771 | 24,811 | 1,465 | 3,029 |
| (03) Information | 27,901 | 5,939 | 21,984 | 27,521 | 1,955 | 5,251 |
| (04) Professional and special services | 205,167 | 8,443 | 146,547 | 62,999 | 4,934 | 16,956 |
| (05) Rentals | 18,503 | 2,442 | 20,483 | 14,755 | 2,095 | 19,885 |
| (06) Repair and maintenance | 779 | 242 | 1,065 | 973 | -385 | 291 |
| (07) Utilities, materials and supplies | 1,924 | 162 | 759 | 2,341 | 709 | 954 |
| (08) Acquisition of land, buildings and works | 756 | 22 | 22 | 741 | 176 | 269 |
| (09) Acquisition of machinery and equipment | 9,485 | 2,399 | 5,101 | 20,359 | 760 | 3,689 |
| (10) Transfer payments | - | - | - | 100 | - | - |
| (12) Other subsidies and payments | 57 | 262 | 830 | 45 | -79 | 471 |
| Total gross budgetary expenditures | 1,015,374 | 194,671 | 788,858 | 756,241 | 170,790 | 504,081 |
| Less revenues netted against expenditures: | ||||||
| Revenues | 120,000 | 27,490 | 60,828 | 120,000 | 38,623 | 51,350 |
| Total revenues netted against expenditures | 120,000 | 27,490 | 60,828 | 120,000 | 38,623 | 51,350 |
| Total net budgetary expenditures | 895,374 | 167,181 | 728,030 | 636,241 | 132,167 | 452,731 |