
2017: The year in statistics

2017 was a year of many firsts at Statistics Canada.
The agency released a rich array of new data products and analyses, expanding its scope to cover new ground and respond to the questions of importance to Canadians.
2017 was also a year of self-reflection for Canada, as the agency released data from its latest census, and social and economic surveys, providing Canadians with a detailed portrait of our country.
We, at Statistics Canada, also turned the mirror on ourselves over the year, examining how we can best modernize to continue providing Canadians with the high-quality information they need to make informed decisions in this complex and increasingly digital world.
2016 Census
In 2017, Statistics Canada released all of the major 2016 Census data on time, covering numerous aspects of Canadians' lives, including their income, ethnocultural diversity, spoken language and education. So, what did Canadians report in the 2016 Census? Here are some of the highlights.
- For the first time in census history, there were more seniors (aged 65 and older) than children (aged 14 and younger) and more one-person households than any other type of household.
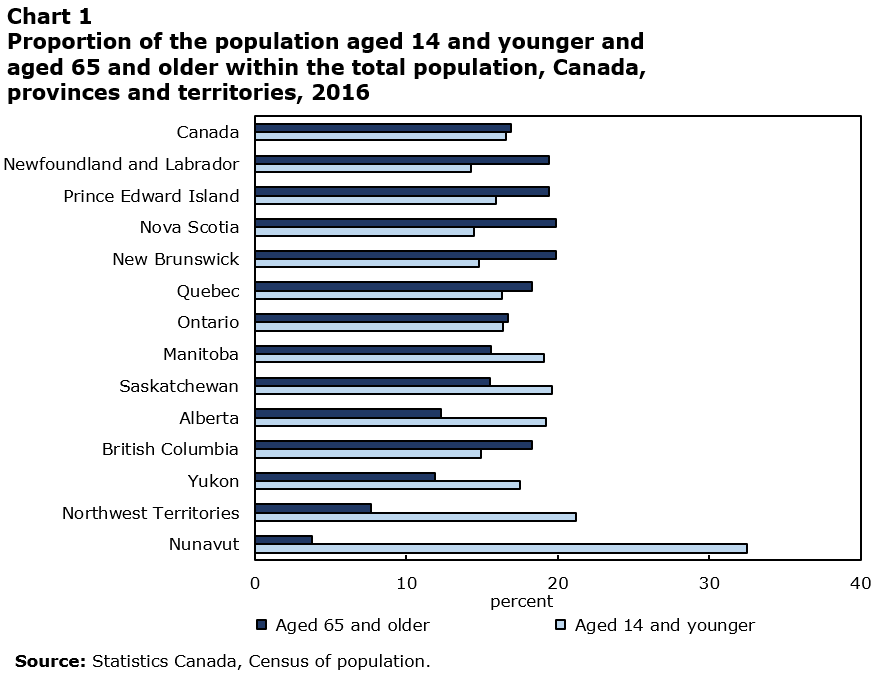
Description: Chart 1
| Aged 14 and younger | Aged 65 and older | |
|---|---|---|
| percent | ||
| Source: Statistics Canada, Census of Population. | ||
| Nunavut | 32.5 | 3.8 |
| Northwest Territories | 21.2 | 7.7 |
| Yukon | 17.5 | 11.9 |
| British Columbia | 14.9 | 18.3 |
| Alberta | 19.2 | 12.3 |
| Saskatchewan | 19.6 | 15.5 |
| Manitoba | 19.1 | 15.6 |
| Ontario | 16.4 | 16.7 |
| Quebec | 16.3 | 18.3 |
| New Brunswick | 14.8 | 19.9 |
| Nova Scotia | 14.5 | 19.9 |
| Prince Edward Island | 15.9 | 19.4 |
| Newfoundland and Labrador | 14.3 | 19.4 |
| Canada | 16.6 | 16.9 |
- More than one-fifth of Canadians were immigrants to Canada, with the highest proportion of recent immigrants coming from Asia (61.8%), followed by Africa (13.4%).
- Since 2006, the Aboriginal population grew by 42.5%—more than four times the growth rate of the non-Aboriginal population over the same period.
Statistics Canada also developed new data visualization tools to help Canadians interpret census results, including a historical age pyramid, a bubble chart on mother tongue, and an interactive chart on the immigrant population. The agency also released the Census Program Data Viewer, a new statistical dashboard that presents key census indicators for basic geographic and socio-demographic data.
These are only some of the fascinating findings and products developed by the 2016 Census Program. For more information on the census and its results, check out our Census Program page.
Crime and justice under the microscope
Statistics Canada took a closer look at crime and justice in Canada in 2017. The agency released data on a number of issues related to crime and justice, providing in-depth reports on homicide, sexual assaults and hate crime.
In particular, the agency closely examined various forms of victimization including sexual assault, child abuse and victimization within the family and how these are dealt with in the criminal justice system. Additionally, reports looking at offending behaviours were also published:
- Family violence in Canada: A statistical profile
- Survey of Maintenance Enforcement Programs: Child and spousal support
- Women in Canada: Women and the Criminal Justice System
- Self-reported sexual assault in Canada
- Childhood physical abuse: Differences by birth cohort
- Police-reported sexual assaults in Canada, 2009 to 2014: A statistical profile
- From arrest to conviction: Court outcomes of police-reported sexual assaults in Canada.
Statistics Canada also provided the first results for a pilot project for measuring organized crime in Canada. This project was launched to improve the reporting of organized crime through Statistics Canada's Uniform Crime Reporting Survey.
New results from the Survey of Financial Security
On December 7, 2017, Statistics Canada released 2016 results from the Survey of Financial Security (SFS). This survey collects information on the assets and debts of families and individuals in Canada. Given Canadians' debt levels, the housing market and bank interest rates, this information provided a deeper understanding of the financial situation of Canadians.
According to the new SFS results, the median net worth of Canadian families more than doubled from 1999 to 2016. Median mortgage debt, however, did not trail far behind, almost doubling from 1999 to 2016.
Statistics Canada also released new data on the mortgage terms of Canadians who hold a mortgage on their principal residence. The average mortgage interest rate for these Canadians was 2.94%.
Relatively more families headed by a senior (aged 65 and older) were in debt in 2016, compared with 1999, mainly because more seniors carried their mortgage into retirement years.
More data on wages
2017 was the first year that Statistics Canada released detailed annual data on wages by occupation from the Job Vacancy and Wage Survey. These new data complement wage data from the Survey of Employment, Payrolls and Hours, the Labour Force Survey and the Census of Population. Data are available for detailed occupation categories, as well as for economic regions.
With these new data, Canadians can now compare the wages paid for different occupations, such as chefs, electricians, computer engineers and nurses, across the country from Cariboo in British Columbia to the Avalon Peninsula in Newfoundland and Labrador to Nunavut.
Tackling the sharing economy
Statistics Canada took a look at measuring the sharing economy in 2017, releasing estimates of the number of people who participated in the sharing economy and the amount of money they spent while they did so.
Statistics Canada added seven questions to the Labour Force Survey concerning Canadians' use of peer-to-peer ride services, such as Uber or Lyft, and private accommodation services, such as Airbnb or Flipkey. The survey was conducted among Canadians aged 18 and older residing in the provinces.
From November 2015 to October 2016, nearly one-tenth of Canadians aged 18 and older used peer-to-peer ride services or private accommodation services, spending $1.3 billion. Younger Canadians were more likely to use these services.
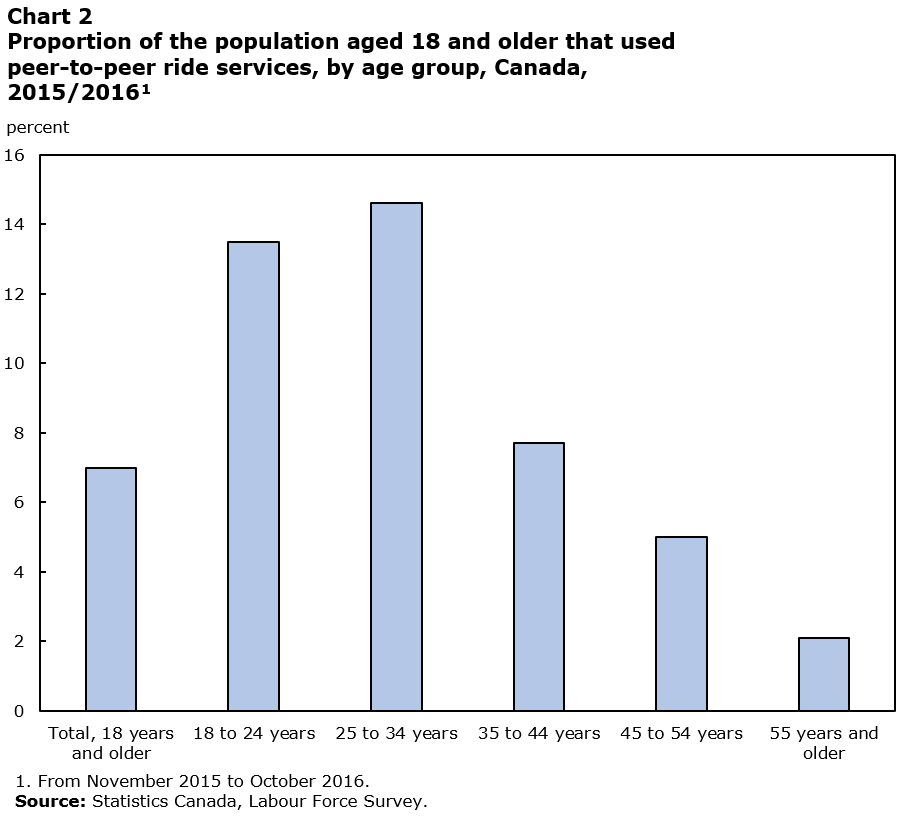
Description: Chart 2
| Percent | |
|---|---|
| Source: Statistics Canada, Labour Force Survey. | |
| Total, 18 years and older | 7.0 |
| 18 to 24 years | 13.5 |
| 25 to 34 years | 14.6 |
| 35 to 44 years | 7.7 |
| 45 to 54 years | 5.0 |
| 55 years and older | 2.1 |
About 72,000 people aged 18 and older offered peer-to-peer riding services and 69,000 offered private accommodation services.
As the sharing economy flourishes and grows in stature, Statistics Canada is preparing to measure its contribution to Canada's macroeconomic accounts, which track gross domestic product, service imports and exports and household expenditure.
Tracking natural resources
The natural resource sector plays an important role in Canada's economy. In the second quarter of 2017, it accounted for 10.8% of Canada's gross domestic product, or $215 billion (nominal terms, at annual rates).
With the new data, Canadians can now track the exports, imports, gross domestic product and jobs generated by Canada's natural resources, by subsector—energy, mining, forest, and hunting, fishing and water. Data are available by commodity, including crude oil, natural gas, wood products, and metal and mining products.
To find out more, check out the latest release on natural resource indicators in the Daily.
Canada and the World Statistics Hub
In 2017, the agency expanded its data holdings and continued to explore new ways of presenting data to the public. On July 7, 2017, the agency launched the Canada and the World Statistics Hub.
The first iteration of the hub gathers and presents different data on Canada's economic and financial relationship with the United States, Canada's most important trading partner. The hub has an intuitive and interactive layout and contains information on trade, investment, employment and travel.
For example, it tracks the number of employees who work at U.S.-owned firms in Canada, as well as the number of employees who work at Canadian-owned firms in the United States. The hub tracks the flow of people travelling between the two countries, by mode of transportation and length of trip (same-day trip vs. overnight trip). To top it off, an interactive map provides information on merchandise trade by Canadian province and U.S. state.
In the coming years, the agency plans on expanding the hub to track Canada's economic and financial relationship with our major trading partners.
From innovation to modernization
While Statistics Canada continued to flex its innovative muscle, we also took a step back to look at the changing information needs of Canadians and the rapidly evolving environment.
With the development of new technologies, Canadians' appetite for information is growing rapidly. To ensure Canadians can access information of high quality, we are looking at ways to modernize our operations to produce more data more quickly.
The agency launched a significant modernization initiative to explore new ways of collecting and producing data through collaborations and partnerships using leading-edge technologies and methods.
To pilot this initiative, four pathfinder projects were created this year: the Measurement of Cannabis, Canadian Housing Statistics Program, Transition to a Low-carbon Economy and Measuring Growth in International Visitors to Canada.
Measurement of Cannabis
Through the Measurement of Cannabis project, the agency aims to gauge the impact of the transition from illegal to legal non-medical cannabis use. The project will assess the impact from an economic, social, health and justice perspective, and will include innovative ways to gather and process data, such as crowdsourcing, web-scraping and modelling.
In November, Statistics Canada published a document detailing the framework it will use to track economic activity related to cannabis. The agency also released new data on cannabis in December. According to experimental estimates of cannabis consumption in Canada, Canadians consumed 697.5 tonnes of cannabis in 2015, representing an estimated value of $5.0 billion to $6.2 billion.
Canadian Housing Statistics Program
The Canadian Housing Statistics Program has been developed in response to the demand for a single, comprehensive source of information on housing. This project is based entirely on the acquisition and integration of administrative data, such as land registry files, property assessment rolls and tax data.
Statistics Canada released its first set of housing data in December, covering non-resident ownership in the Toronto and Vancouver housing markets. According to the new data, non-residents owned 3.4% of all residential properties in the Toronto census metropolitan area (CMA) and 4.8% of all residential properties in the Vancouver CMA.
Transition to a Low-carbon Economy
The third project tracks Canada's Transition to a Low-carbon Economy. This includes measuring the role of clean technology. Statistics Canada is working with information already available from other federal departments and organizations. The agency is also collaborating with the Canadian Space Agency and Federal Geospatial Platform to use new types of data to produce ecosystem statistics.
In December, the agency released its first data from the Environmental and Clean Technology Products Economic Account. According to the account, and clean technology goods and services accounted for 3.1% of gross domestic product and 274,000 jobs in 2016.
Measuring Growth in International Visitors to Canada
The final pathfinder project, Measuring Growth in International Visitors to Canada, Statistics Canada is enhancing tools and strategies already at its disposal and supplementing these with credit card and cell phone data, as well as data from border surveys and frontier counts.
The agency is partnering with other stakeholders to produce satellite accounts for each of the provinces and territories every three years. It is also developing new methodologies using technology, such as artificial intelligence, to produce indicators that Canadians can use to gauge whether tourism initiatives are working.
What these four projects have in common is a shift toward a user-centric focus, the adoption of leading-edge methods and a strong focus on consulting and collaborating with partners and stakeholders. Modernization is about producing statistics that are tailored to the current and future needs of Canadians, businesses and governments.
As our modernization agenda unfolds, the next year promises to yield exciting new endeavours and new statistical horizons to the benefit of all Canadians.
Login/register to post comments.
Recent posts
-
 1904 people recommended this
 -
 2551 people recommended this
 -
 2925 people recommended this